

*********************************************************************************************************
We will be hosting Q4 Housing Themes Presentation on Wednesday, October 4th at 11:00AM ET.
Full details will be released closer to the call.
*********************************************************************************************************
Our Hedgeye Housing Compendium table (below) aspires to present the state of the housing market in a visually-friendly format that takes about 30 seconds to consume

Today's Focus: August Housing Starts & Permits
Given the standard error and magnitude of revision in the Housing Starts & Permits series it’s always prudent to liberally manage your grain-of-salt supply ahead of the monthly release.
And we'll get to chase those salt grains with an extra shot of statistical distortion for the foreseeable future.
Challenging. Yes. Boring. No. Let’s review:
Superficially ….. the internals on the Starts and Permits data this morning told a congruous story of continued underlying improvement as June & July estimates were revised higher, SF Starts accelerated to +17.1% Y/Y and Total Permits rose to the 2nd highest level of the cycle.
The Caveat: The Census Bureau provided a special note accompanying the data release offering some quantitative detail around the hurricane impact. Specifically, "the counties in Texas that were included in the FEMA Hurricane Harvey Individual Assistance disaster declarations accounted for about 4% of U.S. total housing units authorized by permits in 2016, and about 8% of housing units authorized in the South region."
Moreover, the observations/response collection rate was only ~60% in the affected areas, well below the typical response rate of 95% and “the imputation was not adjusted to attempt to reduce the August estimates for any nonreporting jurisdictions.”
In other words, the lower response rate and the inability to fully capture and incorporate the impact to activity in the affected area’s prevents a clean read on South Region and Aggregate estimates.
In other other words, more salt grains.
Looking Forward: While we’ll likely get some quantitative resolution on the impact to Texas in the September data, the statistical noise will be replaced by Irma’s distortive impact on Florida.
Again, per the Census Bureau:
“the impact of Irma in Florida, where the affected counties accounted for about 9 percent of U.S. total housing units authorized by permits in 2016 and 18 percent of those in the South.”
A couple Other Points:
1. State and local level permit data will be available on September 27th and will provide an opportunity for more granular parsing of the impact.
2. Next month represents the easiest comp in years for Total Sermits which printed 1062 (-12% Y/Y) in September of last year driven by a cratering in MF Starts. That comp setup should help to cushion against any hurricane related drag in the data, from a headline and rate of change perspective at least.
If In Doubt, Back It Out: Discretely and convictedly backing out the Harvey impact on August is probably quixotic. However, given the purported size of the affected area (4% of total) and the magnitude of acceleration in new single-family construction (+17% Y/Y) in August, a conservative interpretation is simply that the plodding, but ongoing, underlying improvement in new single-family housing supply that has characterized the Trend remains ongoing. And with permit activity stable to up, the near-term outlook doesn't appear set for negative inflection.
The Data:
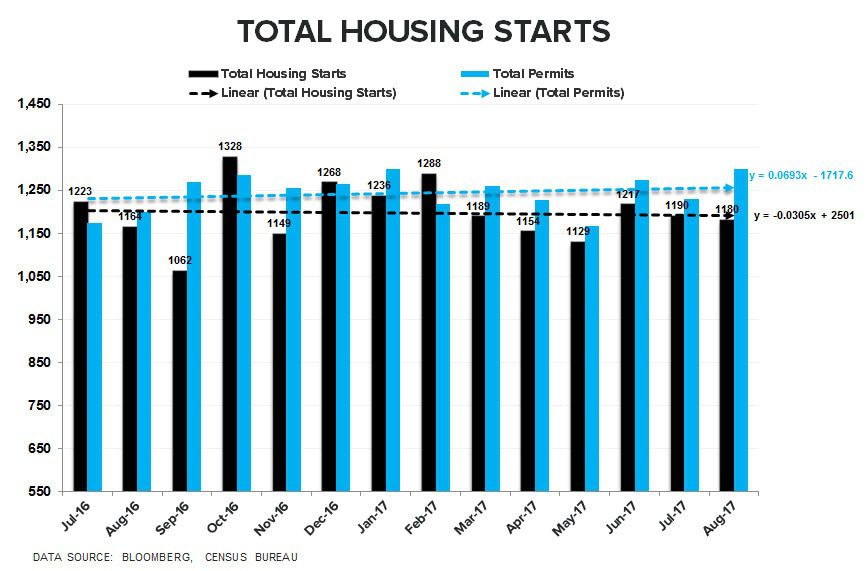
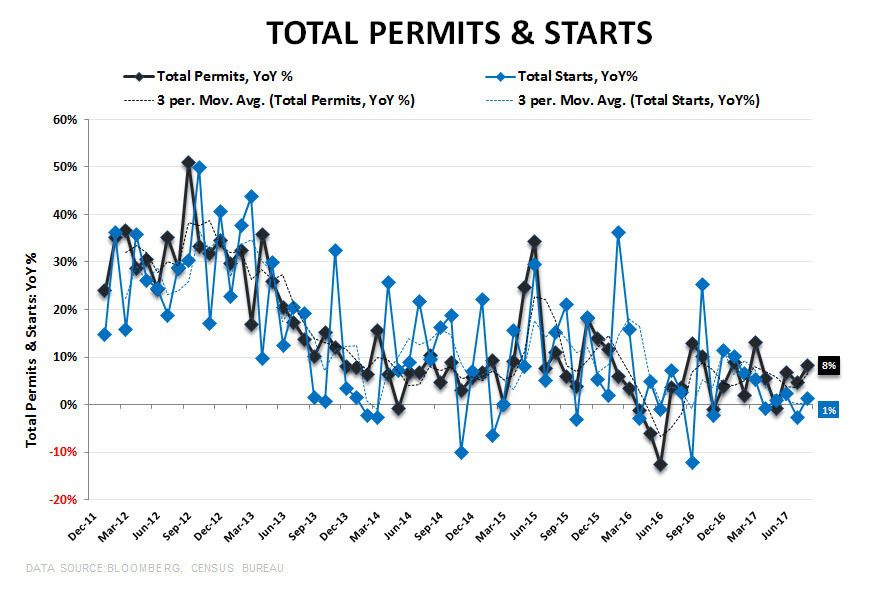
The Census Bureau reported that Total Housing Starts for July declined -0.8% M/M, and increased 1.4% Y/Y to 1.180mn starts.
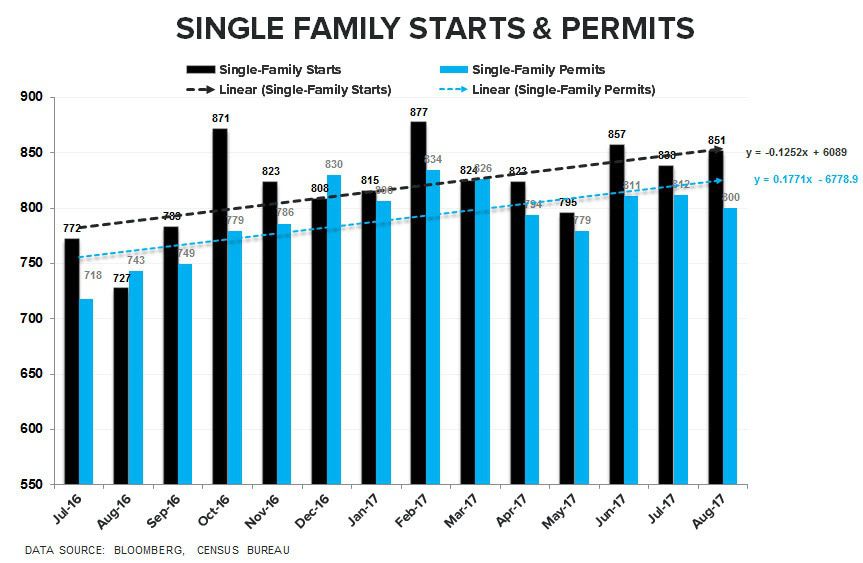
- Single Family Starts increased +1.6% sequentially and +17.1% year-over-year to 851K starts
- Multi-Family Starts declined -6.5% sequentially and -24.7% year-over-year to 329K starts
Total permits increased +5.7% sequentially and +8.3% year-over-year to 1.300mn.
- Single Family Permits declined -1.5% on a sequential basis, but increased +7.7% year-over-year to the current level of 800K
- Multi-Family Permits increased +19.6% M/M and +9% Y/Y to 500K.
Regional: The Southern region managed a +1.3% sequential improvement and +22.8% year-over-year. Note that Hurricane Harvey made landfall in Texas on August 25th, so only 6 days of impact would have been included in these results. The full impact of Harvey and Irma should be reflected in September Starts.
As for the other corridors, the West came through with a +6.5% sequential growth and +14.6% year-over-year; the Northeast with -1.5% sequential decline but +26.9% year-over-year; and the Midwest with -4.3% decline sequentially and -2.7% year-over-year.


About Housing Starts & Permits:
The US Census Bureau records the number of new housing units that have obtained permits for construction and those that have begun construction. This data includes new buildings intended primarily as residential units. The US Census Bureau defines a start as, “Start of construction occurs when excavation begins for the footings or foundation of a building.”
