This guest commentary was written by Jesse Felder of The Felder Report. It was originally published on September 14. Click here to read our special interview with Felder and his answers to Hedgeye's 21 questions.

There are some strange things going on in certain breadth measures of the broad stock market right now. The most popular measure of market breadth has to be the NYSE advance/decline line and this continues to make new highs along with the S&P 500. But this is just part of the story.

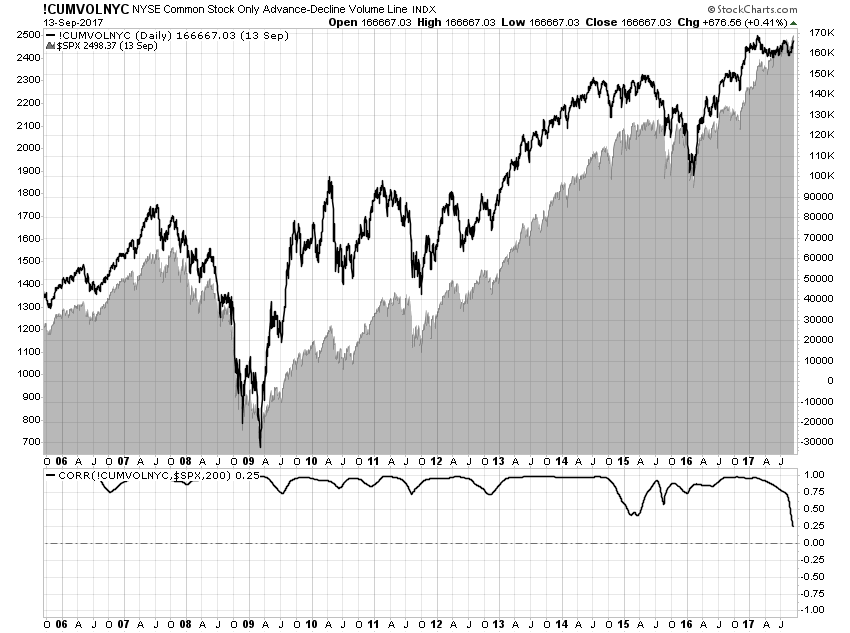
At the same time that the NYSE advance/decline line makes new highs, cumulative volume on the NYSE has failed to do so for most of this year. In fact, this is now the most dramatic divergence between stock prices and cumulative volume in over a decade. In other words, stocks are advancing and in a broad way but the volume of the buying is no longer outpacing sell volume.
And when we look at the ratio of the equal-weight S&P 500 Index to the more popular market cap-weighted index, it, too, shows the largest divergence in over a decade. This simply means that, to a great extent, the smaller stocks within in the index have not been rising nearly as fast as the larger stocks have.

So what gives? My best guess is that the popularity of passive investing via index funds has possibly diminished the value of the advance/decline line as a breadth indictor.
When money goes into index funds it goes into all stocks in the index and the advance/decline line rises. When money goes out the opposite is true. The massive shift from active to passive funds in recent years has had the effect of turning the advance/decline line into a simple reflection of flows into and out of the stock market.
To whatever extent this is true, we are less likely to see divergences in this indicator, even when relative buying volume wanes dramatically and more and more smaller companies begin to lag behind the index, like we are seeing today. And isn’t this exactly what technicians rely on the indicator for?
EDITOR'S NOTE
This is a Hedgeye Guest Contributor piece written by Jesse Felder and reposted from The Felder Report blog. Felder has been managing money for over 20 years. He began his professional career at Bear, Stearns & Co. and later co-founded a multi-billion-dollar hedge fund firm headquartered in Santa Monica, California. Today he lives in Bend, Oregon and publishes The Felder Report. This piece does not necessarily reflect the opinion of Hedgeye.
