Process Guide
Hedgeye’s proven investment process helps you sidestep major losses, compound capital through every market cycle, and invest with real confidence.
It’s the same data-driven process our clients have used since 2008 to protect and grow their wealth.
I. Our Investment Philosophy

I. Our Investment Philosophy

The philosophy is simple: Preserve, Protect, and Compound. Everything begins with managing risk. Our mandate is to avoid major drawdowns so you can compound wealth through all market cycles.

Static allocations fail when conditions change—causing losses and missed opportunities. The economy moves in cycles, and portfolios need to adapt.

Hedgeye’s process does exactly that—forecasting big moves before the crowd and adjusting portfolios with discipline.

•  Manage Risk First – The goal is to grow capital without major drawdowns. Diversification, disciplined position-sizing, and timing are at the core of every decision.

•  Go Anywhere, Not Everywhere – We capitalize on opportunities across U.S. stocks, global equities, bonds, commodities, currencies, and crypto—but only when the data gives us high confidence.

•  Adapt to Flow and Volatility Regimes – Markets are increasingly driven by systematic positioning and volatility (“The Machine”). We track these flows in real time to see when they amplify risk, reduce it, or create opportunity.

What sets Hedgeye apart is how we forecast and execute:

•  Anticipate with Rate of Change Economics – Instead of backward-looking levels, we measure the rate of change in growth and inflation and project it over the next 4 quarters. This helps us anticipate policy shifts and position ahead of big moves.

•  Act with a Quantamental Edge – We combine quantitative Buy/Sell Signals, Macro forecasting, and the work of 40+ fundamental analysts. Research builds the case for a stock or ETF, but nothing gets owned until the Signal confirms the timing. That discipline turns analysis into action.

At the highest level:

•  The GIP Model (Growth, Inflation, Policy) forecasts the economy.
• 
The Quads Map turns forecasts into asset allocation.
• 
The Signals tell us when to buy or sell.
• 
Position Sizing balances opportunity with risk control.

The philosophy never changes: manage risk first, so you can compound capital through the Full Investing Cycle.
II. “The Machine” (And Why It Matters)

II. “The Machine” (And Why It Matters)

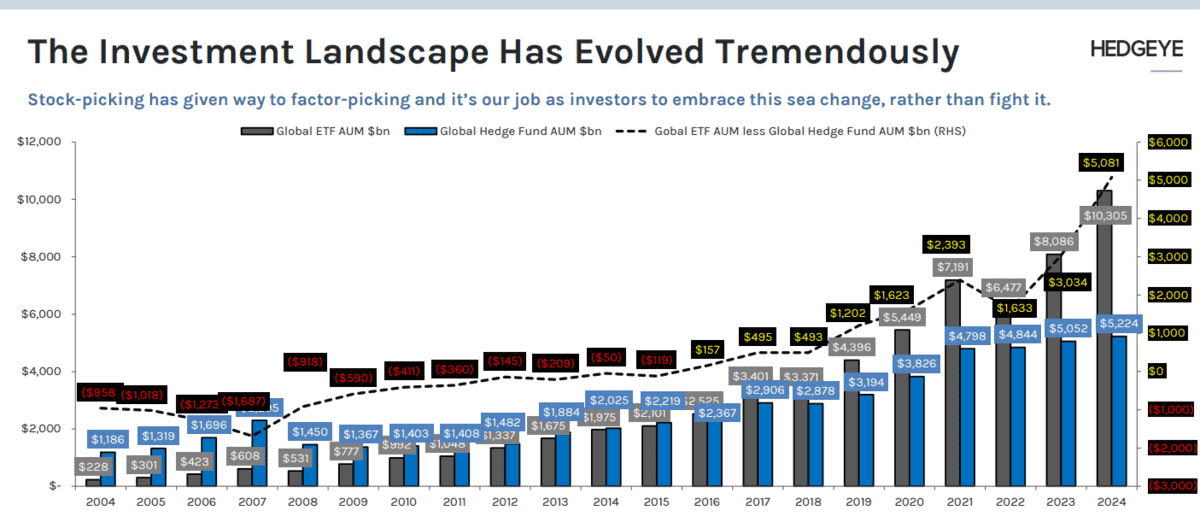
When Hedgeye CEO Keith McCullough talks about “The Machine,” he’s describing the powerful systems that drive today’s markets. This includes algorithms, ETFs, passive flows, and big data—all of which influence prices every second.

Markets no longer move just on company earnings or news headlines. The Machine shapes trading in ways that can blindside investors who aren’t paying attention.

These aren’t small moves. A sudden shift in volatility can unleash hundreds of billions in mechanical buying or selling within days.

And with trillions now managed by systematic strategies, even a minor input—like a drop in volatility—can drive the kinds of gains or losses that make or break your portfolio—regardless of whether fundamentals have changed.

By understanding how it works—volatility, flows, and positioning—you can better anticipate risks and opportunities, instead of getting caught off guard.

Simply put: The Machine is the modern market. If you don’t learn its rules, you risk being left behind.

II. “The Machine” (And Why It Matters) - The Investment Landscape Has Evolved Tremendously

So, what are the rules?

Much of today’s market is controlled by models, not people. When volatility drops, those models mechanically buy more exposure—which can push prices higher. When volatility spikes, they sell quickly, often all at once, triggering sharp drawdowns.

At Hedgeye, we use real-time tools—like Tier1 Alpha’s flow models—to see where these big moves are likely to come from next. That gives us a key edge: we can position before the Machine drives these big price moves.

When you understand The Machine, you stop reacting—and start front-running.

III. Macro Strategy: The GIP Model and Quads

III. Macro Strategy: The GIP Model and Quads

When Hedgeye CEO Keith McCullough was running money as a hedge fund portfolio manager, he learned that getting the Macro call right often mattered more than individual stock picking. That lesson became the foundation of our process.

Hedgeye’s GIP Model—short for Growth, Inflation, Policy—maps the rate of change in gross domestic product (GDP) and the consumer price index (CPI) across time.

Watch: Keith McCullough explains Hedgeye’s math-driven Macro process—and how we front-run big market moves.

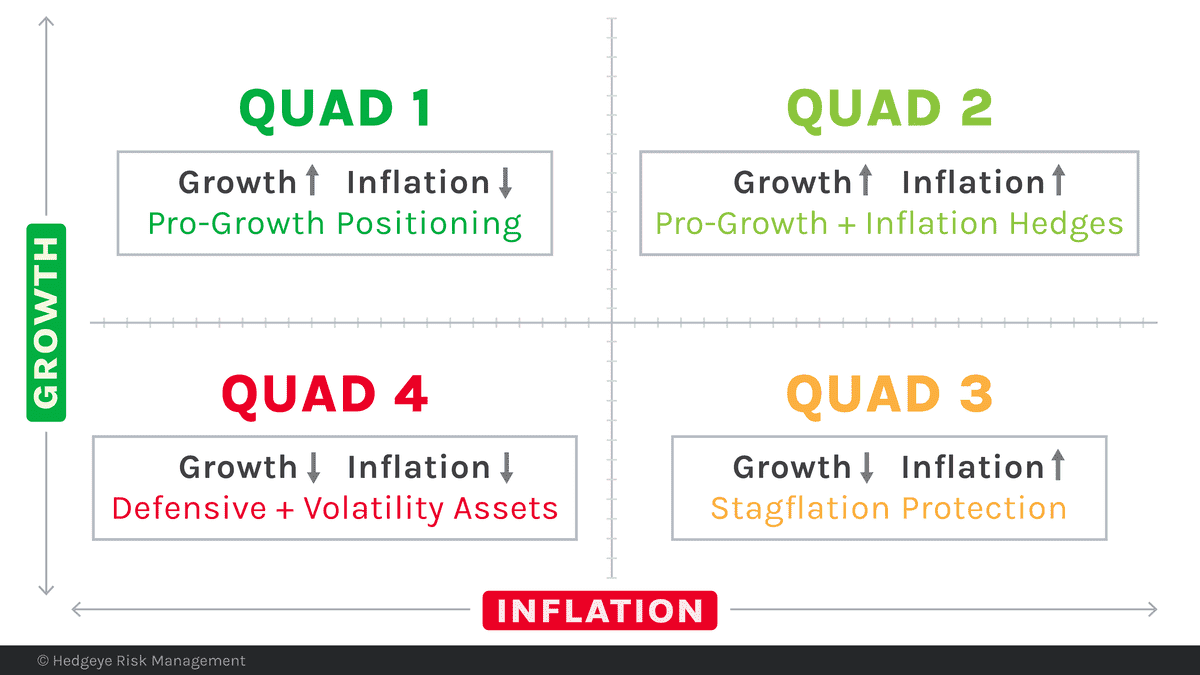
The result is a four-quadrant framework:

III. Macro Strategy: The GIP Model and Quads - Quad Positions

For a deeper look: we’ve back-tested the performance of asset classes, sectors, and style factors across every Quad. View detailed Quad backtests →

By measuring whether growth and inflation are accelerating or decelerating, we categorize the economy into one of four distinct regimes called Quads.

Each Quad has its own playbook — a historical pattern of winners and losers across asset classes, sectors, and style factors. Built on 27+ years of market history and backtests, this framework enables us to position ahead of major market turns.

For the U.S. economy, we forecast Quarterly and Monthly Quads to see broader trends and identify key inflection points.

•  The Quarterly Quad defines the dominant macro regime — the climate. It defines the primary risk backdrop and anchors our core positioning.
•  The Monthly Quad defines the shorter-term overlay — the weather. It moves more frequently and helps identify tradable counter-trend opportunities within the broader regime.

    A Quad 1 month inside a Quarterly Quad 4 isn’t a contradiction — it highlights tactical rallies within a larger risk-off environment.

    We measure intensity, not just direction — a mild Quad behaves differently than a deep one, shaping conviction and sizing. Our Signal then drives timing — it front-runs the market’s move ahead of Quad changes, so we’re never “waiting” for the calendar to be right.

    We also model these inputs for 50+ countries covering ~90% of global GDP. This global scope allows us to Go Anywhere, Not Everywhere — allocating across U.S. stocks, global equities, bonds, commodities, currencies, and crypto, but only where the data gives us high confidence.

    Why it matters: Most investors anchor on backward-looking levels—monthly CPI and quarterly growth reports. By focusing on rate-of-change economics, Hedgeye identifies turning points months before consensus. While Old Wall debates a ‘soft landing,’ Hedgeye is already positioned for the next Quad. We front-run “The Machine”—with process, not emotion.

    👉 In the next section, we’ll show how our quantitative Buy/Sell Signals overlay with the Quads to confirm price direction and provide precise timing for entries and exits.

    IV. Risk Range Signals: When Should I Buy/Sell?

    IV. Risk Range Signals: When Should I Buy/Sell?

    Hedgeye’s Founder Keith McCullough built the Risk Range™ Signals model during his years as a hedge fund portfolio manager. His goal was simple: augment his fundamental research with a quantitative tool that could help him actually buy low and sell high.

    Watch: Keith McCullough explains why he built the Risk Range™ Signals model and how his hedge fund experience shaped Hedgeye’s quantamental process.

    Why it Matters

    Most investors buy high and sell low because they anchor on stories or lagging data. The Risk Range™ model turns market timing into a repeatable process.

    Since 2008, Hedgeye has issued more than 6,400 winning trade signals through our Real-Time Alerts product, achieving a 74–87% win rate every year.

    The Foundation: Price, Volume, and Volatility

    The signaling model is built on three simple inputs: price, volume, and volatility. From there it generates a probable trading range for any asset.

    •  Low-End of the Risk Range™ (LRR): when you buy/add
    •  Top-End of the Risk Range™ (TRR): when you sell/trim
    • 
    Breaks in TREND and/or TAIL support levels: when you exit completely

    Signals are multi-duration, dynamically updating across three horizons:

    •  TRADE – 3 weeks or less, used for entries and exits
    • 
    TREND – 3 months or more, for intermediate-term cycle direction
    • 
    TAIL – 3 years or less, long-term conviction and regime shifts

    As Keith explains:

    “Fractal signals can change quickly as the market itself moves — sometimes intraday, sometimes over weeks, depending on the duration you’re measuring.”

    Watch: Keith McCullough walks through Risk Range™ Signals in practice — TRADE, TREND, TAIL, phase transitions, and how to use buy/sell levels incrementally.

    The ideal setup to buy or add is when:

    •  The asset’s signal is Bullish TRADE and TREND
    •  The asset is making Higher Lows and Higher Highs
    •  Price is near the LRR

    Typical adds to a current position are 50–100 basis points, scaled to conviction and volatility. We may add 150-200 basis points on Bullish Breakouts (when price breaks out above TRR and holds there).

    When to SELL-SOME (Partial Exits)

    Trimming matters. It’s how you lock in gains without abandoning the trend.

    We often sell-some of a long position when:

    •  Price nears the TRR (lock in some gains)
    •  TRADE breaks neutral/bearish while TREND remains bullish
    • 
    The asset is making Lower Highs

    Typical trims are 50–100 basis points. When volatility spikes, we may trim more.

    When to EXIT Completely

    We exit a position entirely when:

    •  Both TRADE and TREND break
    •  The asset is making Lower Highs and Lower Lows
    • 
    Or the position hits a stop-loss based on your personal risk management rules

    No story, no hope — just math.

    As Keith says:

    “I see these as just tickers, not my marriage or religion. Therefore, it’s a lot easier for me to get out of things than it might be for those who ‘believe’ in the story.”

    Context Matters: The VIX Buckets

    Check the volatility regime before acting on a Signal:

    •  VIX 9–19: Investable bucket (buy dips, normal risk)
    •  VIX 20–29: Chop bucket (trade ranges, be aggressive on longs)
    • 
    VIX 29+: “F*ck bucket” (defensive, preserve capital)

    Signals work in all regimes, but sizing and conviction change with volatility.

    Where to Access Hedgeye’s Signals

    •  Risk Range™ Signals – 30+ daily Buy/Sell “levels” and trend signals
    •  Real-Time Alerts – Intraday trade alerts for stocks and ETFs
    •  Early Look – Daily pre-market newsletter with 15+ Macro signals
    •  Investing Ideas & ETF Pro Plus – High-conviction stock & ETF ideas
    •  Signal Strength Stocks – Keith McCullough’s quant-based stock picks

    👉 In the next section, we’ll show how position sizing fits in — so even when you get the Signal right, no single trade can wreck your portfolio.

    V. Position Sizing: Balancing Opportunity and Risk

    V. Position Sizing: Balancing Opportunity and Risk

    Position sizing is how you take Hedgeye’s research and signals and actually build and manage a portfolio. Without it, you just have ideas. With it, you have a disciplined way to balance opportunity with risk management.

    Even a high-probability signal isn’t guaranteed. Hedgeye’s Real-Time Alerts has achieved a 74–87% win rate every year since 2008 — never 100%. Some trades won’t work. Proper position sizing ensures your financial future never hinges on a single trade.

    Keith’s Position-Sizing Framework

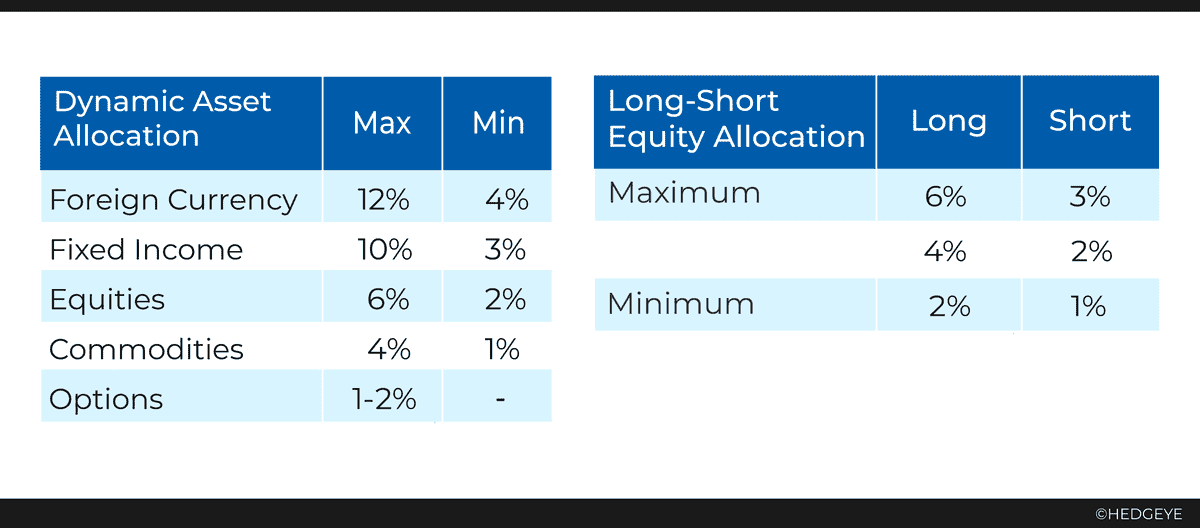
    Here’s how Hedgeye CEO Keith McCullough defines his minimum and maximum position sizes by asset class:

    V. Position Sizing: Balancing Opportunity and Risk - Keith Framework For Position Sizing

    Adds are usually made in 50–100 basis point increments, scaled based on conviction and volatility.

    Watch: Keith McCullough explains his approach to position sizing — why every investor needs rules, and how min/max sizing works across asset classes.

    Your Framework

    Keith’s rules work for him, but every investor needs to define their own. Your account size, risk tolerance, and asset class scope may be different.

    The key is consistency: define your minimums and maximums ahead of time, then use the Signals to scale up or down within those ranges.

    Example: Hedgeye in Action

    Suppose Keith issues a Real-Time Alerts BUY SIGNAL on a U.S. equity ETF:

    •  Using Keith's framework, the position starts at the minimum allocation of 2%
    •  On a down day, the ETF nears the Low-End of the Risk Range (LRR) while the TREND Signal remains Bullish
    •  You add incrementally in 50–100bps steps, building conviction as the setup strengthens
    •  Over time, the position can grow toward Keith's max size of 6% for an equities position
    •  If the TREND breaks, the position is reduced or exited

    This ensures the position is always risk-managed inside pre-set boundaries — never too small to matter, never so big it can blow you up.

    Bottom Line

    Position sizing is how Hedgeye’s Macro, Fundamental, and Quantitative work comes together and fits in your portfolio. It’s the discipline that lets you compound capital while ensuring that no single trade has the power to define your outcome.

    VI. Recommended Resources

    VI. Recommended Resources

    Learning the Hedgeye process is never “done.”

    The more you study, the more confidence you’ll have applying it across cycles. Here are the best places to deepen your understanding of Hedgeye and financial markets:

    •  Master the Market – A hedge fund manager’s guide to process and profit, by Hedgeye CEO Keith McCullough.

    •  Product User Guides – Learn to navigate our products with confidence.

    •  Macro Week Summary Notes (subscription required) – An intuitive summary of the most important market developments.

    •  Real Conversations – The sharpest minds in investing go one-on-one with Hedgeye CEO Keith McCullough.

    •  Keith’s Top 7 Books – A curated reading list with Amazon links.

    •  Glossary - A quick reference guide to the terms and concepts used throughout our research.

    Watch: Coaching Session with Keith McCullough — portfolio sizing, timing, and how to apply Hedgeye’s process across the full investing cycle.

    Risk Management Guides
    Want a little more detail on how to apply the process in real time?

    •  TRADE vs. TREND Decision Rules 

    •  Position Sizing Principles

    •  Spotting Phase Transitions

    You're Leaving Hedgeye Risk Management...

    By selecting this link, you are now leaving the Hedgeye Risk Management (“HRM”) website. The following website contains information concerning investment products managed by Hedgeye Asset Management (“HAM”), an affiliate of HRM, or a firm partnering with HAM, and is subject to HAM’s Privacy Policy. As a separate legal entity, all HAM asset management services are made independently by portfolio managers at HAM and, as such, funds may vary from HRM research.

    HRM is not responsible for the accuracy or completeness of information on external websites. HRM does not make any representation regarding the advisability of investing in any investment product or any particular investment advisory. Any opinions or recommendations from linked websites are solely those of our affiliate and are not the opinions or recommendations of HRM.

    HRM DOES NOT PROVIDE PERSONALIZED INVESTMENT ADVICE OR ENGAGE IN ANY ASSET MANAGEMENT SERVICE. LASTLY, THIS LINK IS NOT AN OFFER TO BUY OR A SOLICITATION TO SELL ANY SECURITY OR INVESTMENT PRODUCT, OR THE SOLICITATION OF ANY ADVISORY SERVICES.