October was a nasty month for investors blindly buying the S&P 500.
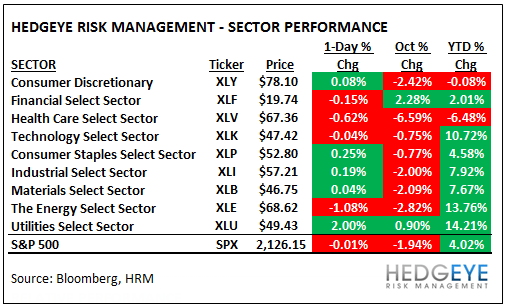
Stocks broadly were down -1.9% on the month. Meanwhile, Healthcare got absolutely shellacked and was easily the worst performer, down -6.6% on the month.
The chart above has the complete S&P 500 sector breakdown. As you can see in the Chart of the Day below (from today's Early Look), our favorite long, Utilities (XLU), and short, Financials (XLF), shows a nice spread of +1220 basis points of outperformance for Utes. Also notable, the #LateCycle sectors, those most prone to the continual slowdown of the U.S. economy, were hit the hardest.
Here are the highlights:
- Financials (XLF) +2.3%, earning its entire return for 2016 YTD in OCT = +2.0% YTD
- Utilities (XLU) chugged along, closing +0.9% in OCT at a league leading +14.2% YTD
- Healthcare (XLV) took up the #LateCycle rear, down a big -6.6% in OCT = -6.5% YTD
- Energy (XLE) got tagged into month-end, closing -2.8% for OCT = +13.7% YTD
- Consumer Discretionary (XLY) sucked #LateCycle wind too, down -2.4% OCT to -0.1% YTD

