

We're going through our investment thesis on CRI next Wednesday, November 2nd at 1pm with a full deck vetting our Short Call.
We were short CRI once, and were ultimately wrong. Never again. The fundamentals, the cycle, the cost structure, the customer base, and growth strategy have all evolved since then, and for the most part we don't like what we see.
Timing is everything, and in our deck we're going to map out the timeline to a slowing top and bottom line, and when CRI should start to miss expectations for the first time in its history as a public company.
Call Details:
Toll Free:
Toll:
UK: 0
Confirmation Number: 13647737
Materials Link: CLICK HERE
Video Link: CLICK HERE
From 10/2...
We added Carter’s to our Short List on October 2nd. A few points up front before we go through the TTT call.
Full Disclosure -- I was short this before and was wrong.
- My concern was that CRI has very little delineation in product by channel.
- Generally speaking, wholesale buyers at Macy’s, Target and Kohl’s don’t like when they can find identical product to what they’re buying in Carter’s own retail stores and online at lower prices.
- This is at the same time we were seeing new competitors come onto the scene like Giggle, Gap/Old Navy, Honest, and stepped up growth by Disney, and the ever-aggressive Children’s Place.
- Though we’d argue that CRI obfuscated this more challenging US growth profile with acquisitions and growth outside the US (inherently lower margin in Softlines retail), the reality is that the company made the portfolio crank – on a fairly consistent basis. That’s what good management teams do – and the current one is worlds better than the horrible Rowan-regime from a decade ago.
- We got off our short at $65 – losing 20% on our trade – but we got out before the run to CRI’s peak of $106.
- Despite the drop back to $86, we think it’s time to dip our toe in the water.
- This is not yet a ‘best idea’, but we’re diving head-first into the research and will either press this one, or find out why we’re wrong in our thinking/analysis.
Here’s the TTT (TRADE, TREND, TAIL -- in reverse order).
TAIL:
- Let’s just agree up front…this is a good company, with great brands, and above-average management.
- It has been a consistent share gainer in every category in which it competes.
- Its product distribution is diversified both brand, consumer (baby/toddler/child), channel and geography.
- Management has put up a very steady 13% EPS CAGR over three years, and has driven margins to a new peak of near 12%, RNOA from 9% to 12%, and has driven debt/equity from 85% to 65% over the same period – while squeezing out 28% ROE.
- No surprise that it’s commanded a 20x-25x EPS multiple and 12x EBITDA multiple as we entered the back half of this economic cycle.
- But…there are a few factors we don’t like.
A) Demographics – which have been a big tailwind for CRI – are starting to go the wrong way. We’re not so disillusioned to think that a declining birth rate will all of a sudden make CRI miss a quarter by 20%. But the backdrop is enough to cause its multiple to test lower highs and lower lows.

Data From Hedgeye Healthcare's Proprietary Maternity Tracker, Contact sales@hedgeye.com for details on our Healthcare team's research.
B) Market Share -- Any way you slice it, the company’s rate of share gain is slowing. It went from 5% share of the children’s wear market in 2008, and is now over 10%. But what was 80-100bp share gain annually went to 70bp in 2013, 50bp in 2014, 20bp in 2015, and does not appear to be heading higher in 2016.

C) Channel Diversification is a double edged sword. The chart below showing channel share over a decade is very interesting to us.
i. Simply put, this screams balance. We’ve seen department stores go from 37% of sales to 23%.
ii. Mass (WMT/TGT/COST) go from 17% to 12%.
iii. CRI-owned (leased) stores hanging tight at 40%.
iv. E-comm above 10% from zero just five years ago.

We still think that CRI does not have enough product differentiation by channel, and the online growth in both its own channel as well as the online growth in wholesale partners will allow the consumer to get much smarter in arbing a better price/value. As noted, that was not enough to hang our hat around at the start/midpoint of this economic cycle, but we think it has more teeth than it did before.
D) We don’t like Carter’s lease trends. Again, this is not a near-term ‘long thesis killer’. But CRI’s weighted average lease duration has gone up by 25% since 2008. For most companies, this is net bearish – as it suggests that they are locking in longer obligations (i.e. betting that stores will be more relevant for a longer time period) or are signing steeper rent escalators to buoy near-term affordability. Perhaps in CRI’s case this is a function of Int’l stores – it’s possible. This is definitely something for us to research further.

TREND:
- The Street is looking for 4-5% comps in each quarter in the back half – that’s on top of 5% square footage growth. We’re not liking this.
- One plus is that there is a definite degree of restocking on basics in the department store and mass channels as inventory corrected in the second quarter. We think people are making a bigger deal out of this than they should – as inventories are definitely NOT lean – i.e. not enough for the wholesalers to stock up. They’re simply at the level where we might see growth in orders tick up by a percent or two.
- On the flip side, cotton is up 25% since the February lows – and oil being on a similar trajectory will not help the margin equation here. Like we see with HBI – which we think is in deep trouble – there is a 9-12 lag between when higher costs flow through the P&L. Nine months = November. This does not bode well for 4Q margins.
- At the same time the Street is looking for 120bps in 2H, and then another 40bps in 2017. There’s no reason why gross margins need to push new peaks given the environment we’re in and the retail landscape becomes massively more competitive. The Street is also looking for -1% EPS growth in 2Q to accelerate to +17% by 4Q and another 10% next year. That’s not egregious, but we’re modeling a flat year in ’17.
- We should note our view that 2017 will be the beginning of a significant bifurcation in winners vs losers in Retail. CRI is not an inherent loser, but unfortunately half of its distribution is.
- One near-term factor we’d point to today is that CRI’s e-comm trends simply do not look good. What has been relatively healthy for the year-to-date has turned down recently. The back-test on this data, in particular, is mixed. But the incremental trend is not promising.


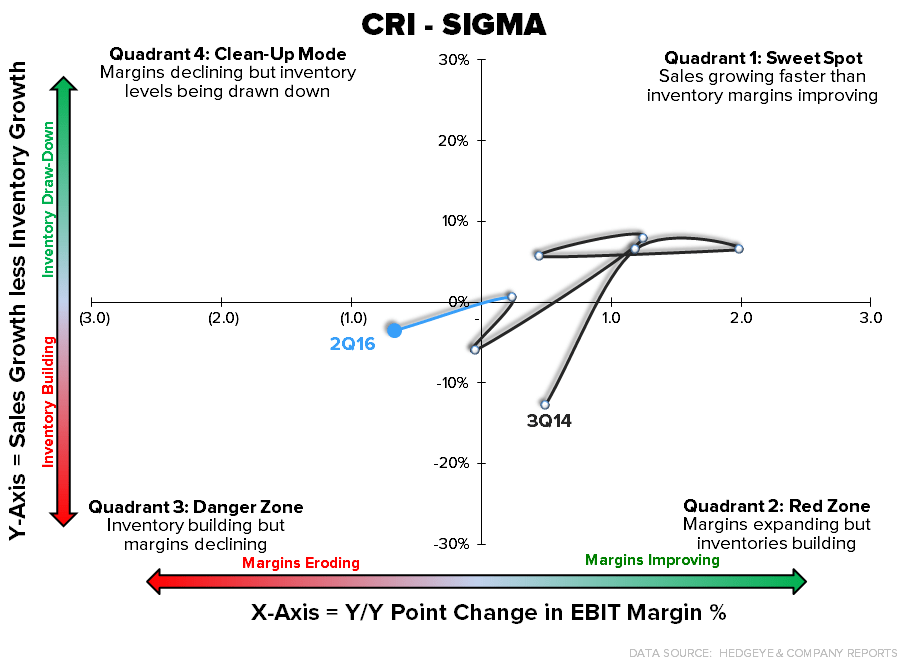
A) SIGMA: an ugly sigma move last Q, with a tougher compare upcoming. After spending a full year with sales/inventory spread triangulating positively (bullishly), inventories have built in 2 of the last 3 Qs.
B) The algorithm compares start getting tough for CRI. Good companies ‘comp the comp,’ and CRI might pull one out of a hat. But the cards are stacked.

TRADE:
- 3Q release is for Oct 27 before the open.
- Maybe CRI hits the near-term Street numbers – after all, it is the master of the ‘beat and guide down, and beat again, and guide down again’ game. It’s been foolish to bet against this company beating a quarter (it hasn’t missed a quarter this decade).
- Short interest has risen over the last 2 months, but is still sitting at just 4.8% of the float. People might point to this being mid-high relative to history. But it’s still low for a company with slowing growth like CRI.
- Again, looking ‘cheapish’ relative to ‘history’ at 9.1x EBITDA – but again, history is not relevant here. We think numbers are too high next year – which puts it back up to 11x EBITDA if we’re right.
- After some big insider sales in late 2015 to early 2016, insider activity has slowed, which obviously goes against this call. Management has been relatively good traders of the stock in the past, to be fair. The difference is that they might not know that they’re likely to miss in 2017.

