Five of eight Risk Monitor metrics were worse week over week as of Friday's close, with one neutral and two positive. Greek bond yields continued to climb as Greek CDS broke out to an all-time high last week, but high yield and the TED spread both showed small improvements, on the margin. We'll keep a close eye on this dynamic in the coming weeks.
Our risk monitor looks at the following metrics weekly:
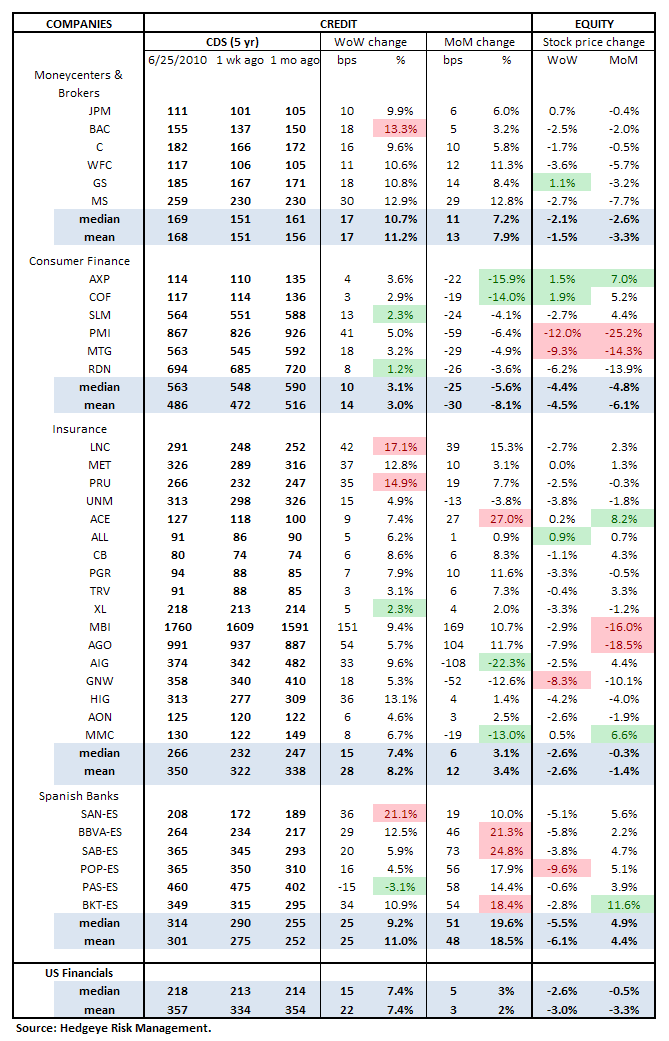
1. CDS for all available US Financials (30 companies).
2. High Yield
3. Leveraged Loans
4. TED Spread
5. Journal of Commerce Commodity Price Index
6. Greek Bond Spreads
7. Markit Subprime Spreads
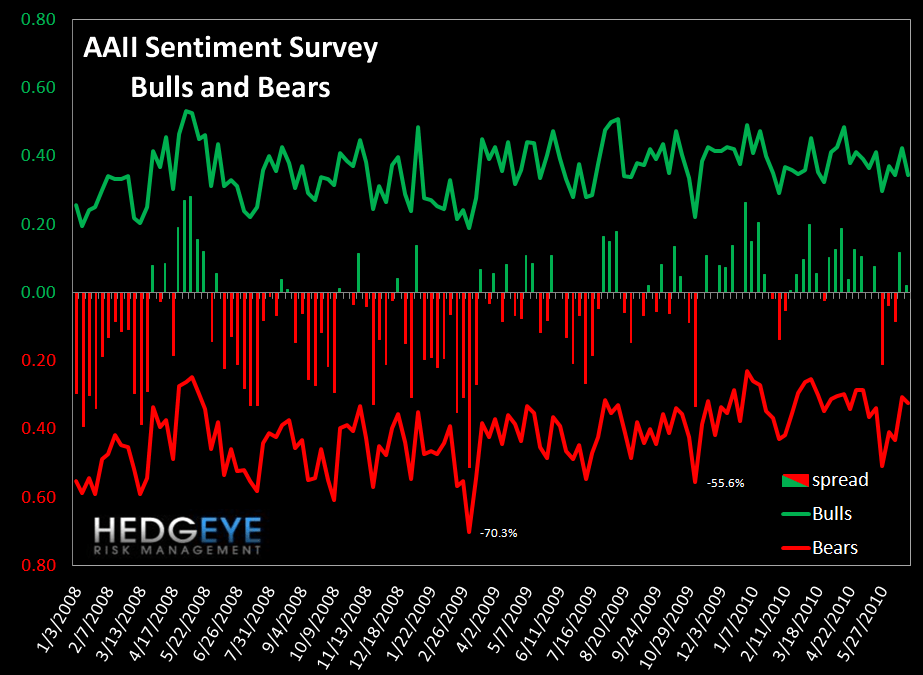
8. AAII Bulls/Bears Sentiment Survey
1. Financials CDS Monitor – After coming down across the board in last week's Risk Monitor, this week credit default swaps ticked back up. SLM, RDN, and XL saw the smallest percentage increases, while BAC, LNC, and PRU increased the most week over week. The field is mixed on a month-over-month basis, with AXP, COF, and AIG decreasing the most and ACE, BBVA-ES, SAB-ES, and BKT-ES increased the mostl. Conclusion: Negative.
2. High Yield (YTM) Monitor - High Yield rates fell 5 bps last week, with a climb in the last few days halting last week's sharp move down. Despite this momentum shift, rates finished at 8.89%, down from 8.94% last Friday. Conclusion: Positive.

3. Leveraged Loan Index Monitor - Leveraged loans were flat last week, rising a fraction of a point, enough to round up to 1464 versus 1463 last week. Conclusion: Neutral.

4. TED Spread Monitor - The TED Spread is a great canary. It continued to fall last week closing at 40.8 bps down from 44.4 bps in the week prior. Conclusion: Positive.

5. Journal of Commerce Commodity Price Index – The JOC smoothed commodity price index is another useful leading indicator. A sharp sell-off in this index starting in July ’08 heralded further declines in the stock market. This week, the index fell from 16.48 the prior Friday to 15.21 last Friday. Conclusion: Negative.

6. Greek Bond Yields Monitor - The Greece situation remains in flux and so we include Greek Bond 10-Year Yields as a reflection of that dynamic. Disturbingly, last week Greek CDS reached an all-time high, blowing out above the pre-bailout elevation. Greek bond yields mirrored this dynamic, increasing 100 bps from 942 to 1042 ahead of the G20 meeting. Conclusion: Negative.

7. Markit ABX Index Monitor - We use the 2006-2 series and look at the AAA, AA, A and BBB- series. Last week the AAA series moved down, while the other tranches were mostly flat. We include this measure as a reflection of what is going on in deep subprime distressed paper. Conclusion: Negative.

8. AAII Bulls/Bears Monitor - The Bulls/Bears survey grew more bearish on the margin vs last week. Bulls decreased by 8% to 34.5% while bears rose 1.7% to 32.4%, putting the spread at 2% on the bullish side, versus 12% to the bullish side last week. Conclusion: Negative.
One caveat is that our interpretation of the AAII Bulls/Bears survey is that a more bearish reading is bearish. Most market observers would use this survey as a contrarian indicator, which we wouldn't disagree with from a practitioner standpoint. However, for the purposes of this risk monitor, we treat an increase in bearish sentiment as a negative.
Joshua Steiner, CFA
Allison Kaptur
