“Two tigers cannot live on one mountain.”
-Chinese Proverb
It’s good to be back in the saddle this morning. I hope you enjoyed your long weekend with family and friends.
Per Richard McGregor in Asia’s Reckoning (timely/topical #history book I read on vaca), the Chinese often quote the aforementioned “ancient idiom when speaking about Japan. The phrase succinctly conveys how many Chinese view their competition with Japan to be the dominant indigenous power in Asia.” (pg 4)
Now that the Chinese Politburo meetings gave the all-clear on China “stabilizing” this weekend, is this Aging Asian Tiger going to roar into Quad 2 like it did during China’s 2016 stimulus? Or are Global Equity markets now officially holding this No-Fear Tiger by the tail, hoping that this happy complacency never goes away?
Back to the Global Macro Grind…
Welcome to Macro Monday here @Hedgeye!
For those of you who are new to our independent research and risk management #process, on the 1st day of every week we review last week’s macro market moves within the context of intermediate-term @Hedgeye TRENDs.
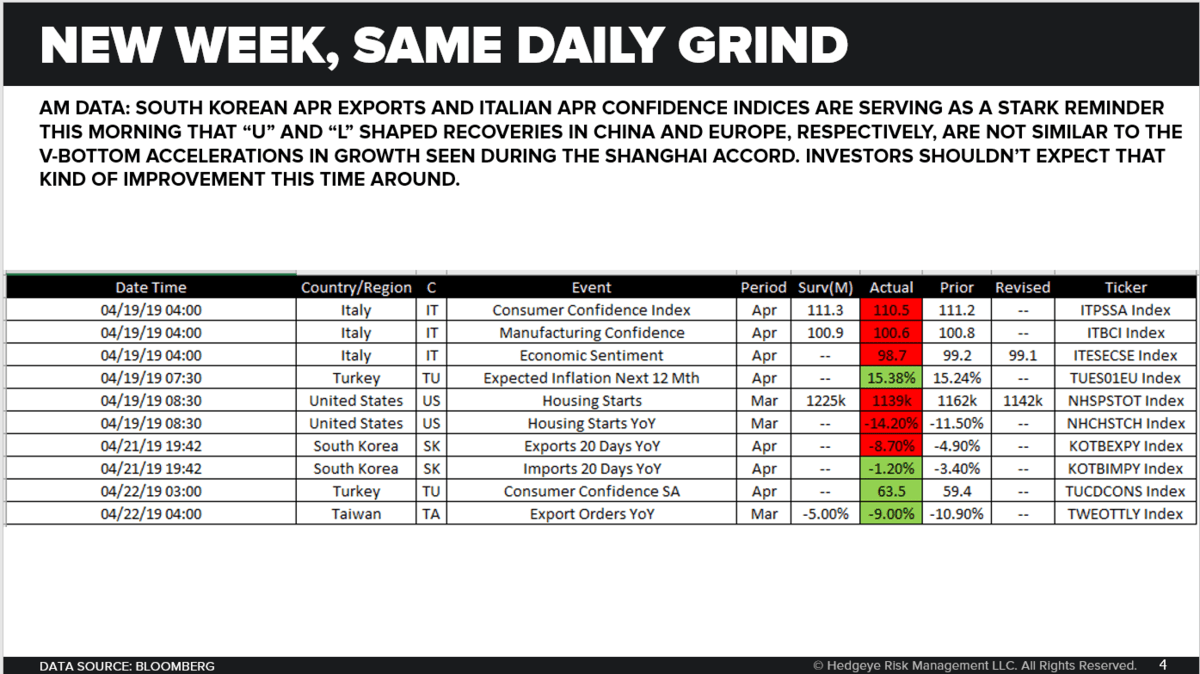
The slope of a Quad 3 (USA) slow-down matters inasmuch as the slope of a Quad 2 (China) acceleration does. As my Chief of Global Data Dependence (Darius Dale) will remind our clients in Chicago today, “U” and “L” shaped recoveries in China and Europe, are not similar to the “V-Bottom” #accelerations in growth seen during the Shanghai Accord in 2016.
And… back to the tigers living on this mountain of complacency… that makes the Global Equity market pricing of the “all clear” (vs. Global Bond Yields which continue to fall on a TRENDING basis) as interesting as it always gets at this stage of the US economic cycle in particular. This time we have 3 tigers triggering consensus complacency too: China, The Fed, and Trump.
*Defining consensus complacency: there’s currently a -169,908 net SHORT position (non-commercial CFTC futures & options contracts) on The VIX. That scores -1.9x on a 1-year z-score.
Back to the weekly measuring and mapping of what the market has priced in, here’s what Global Currencies did last week:
- US Dollar Index was up another +0.4% last week to +1.3% YTD and remains Neutral TREND @Hedgeye
- EUR/USD was down another -0.5% last week to -1.9% YTD and remains Bearish TREND @Hedgeye
- Yen was +0.1% vs. USD last week to -2.0% YTD and remains Bearish TREND @Hedgeye
- Pound was -0.6% vs. USD last week to +1.9% YTD breaking back to Bearish TREND @Hedgeye
- Swiss Franc was -1.2% vs. USD last week to -3.2% YTD and remains Bearish TREND @Hedgeye
- Brazilian Real was -1.4% vs. USD last week to -1.4% YTD and remains Bearish TREND @Hedgeye
If we’re wrong and the Global Economy was “V-bottoming” into a Global Quad 1 and/or Quad 2 recovery (with USA #accelerating in kind), USD would be breaking down, hard, like it did during the 2016-2017 Globally Synchronized Recovery.
That said, on decelerating volume last week, some Global Equity Markets continued to price in some-shaped-recovery:
- Chinese Stocks (Shanghai) were up another +2.6% last week to +31.2% YTD and remain Bullish TREND @Hedgeye
- German Stocks (DAX) were up another +1.9% last week to +15.8% YTD and remain Bullish TREND @Hedgeye
- Mexican Stocks were +1.9% last week to +9.3% YTD and remain Bullish TREND @Hedgeye
At the same time, South Korean Stocks (KOSPI) flashed a negative #divergence closing down -0.9% last week “pricing” in some percentage of this morning’s South Korean Exports #Slowing (again) to -8.7% year-over-year in April vs. -4.9% in March.
Not that the Old Wall or its media will pick up on the SK data point this morning, but that’s what DD means by “L-shaped” – when something big (like South Korean Exports) slows at a lesser rate in MAR, then decelerates again in APR.
US Treasury Yields are sort of like that. After a big 2-3 week Counter @Hedgeye TREND bounce off the 2019 lows:
A) UST 2yr Yield dropped 1 basis point last week to 2.38% and remains Bearish TREND @Hedgeye
B) UST 10yr Yield dropped 1 basis point last week to 2.56% and remains Bearish TREND @Hedgeye
The fact that it was the 17th week in the last 24 where the UST 10yr Yield dropped on a week-over-week basis notwithstanding, my vaca-filled-inbox was almost exclusively asking if the “bottom is in” in Treasury Yields last week.
Since many questions are focused on short-term performance moves, that made complete sense as the 2 Sector Styles we like when the US Economy is in either Quad 4 or Quad 3 corrected alongside the Russell 2000 last week:
- REITS (VNQ) corrected -2.9% last week to +14.6% YTD but remain Bullish TREND @Hedgeye
- Utilities (XLU) corrected -1.6% last week to +8.3% YTD but remain Bullish TREND @Hedgeye
- Russell 2000 (IWM) was down another -1.2% last week to +16.1% YTD and remains Bearish TREND @Hedgeye
Unlike the “YTD” move, the Russell looks nothing like being long REITS and/or Utes going back to when we made the Quad 4 in Q4 of 2018 call. Since putting in its #PeakCycle (Quad 1 and Quad 2) all-time high in Q318, the Russell is DOWN -10.0%.
What else was down last week:
- Commodities (CRB Index) were -0.7% last week to +10.2% YTD but remain Bullish TREND @Hedgeye
- Gold was down -1.5% last week to -1.4% YTD but remains Bullish TREND @Hedgeye
- Copper was down -0.9% last week to +10.8% YTD and remains Neutral TREND @Hedgeye
So I’ll stay with buying the damn Quad 3 dips in things like Oil, Energy Stocks, Gold, Gold Miners, REITS, Utes, Tech, etc. and I’ll stay away from things like Financials (XLF) that pop when consensus thinks US Growth and/or “interest rates” are going to “break-out” to the upside. That only happens when US Cyclical Tigers roar into Quad 2.
Our immediate-term Global Macro Risk Ranges (with intermediate-term TREND signals in brackets) are now:
UST 10yr Yield 2.45-2.62% (bearish)
UST 2yr Yield 2.27-2.43% (bearish)
SPX 2 (bullish)
RUT 1 (bearish)
NASDAQ 7 (bullish)
Utilities (XLU) 57.00-58.41 (bullish)
REITS (VNQ) 84.49-88.99 (bullish)
Energy (XLE) 66.40-68.52 (bullish)
Financials (XLF) 26.12-27.68 (bearish)
Shanghai Comp 3131-3298 (bullish)
DAX 115 (bullish)
VIX 11.40-15.75 (bearish)
USD 95.80-97.50 (bullish)
EUR/USD 1.11-1.13 (bearish)
USD/YEN 110.90-112.52 (bullish)
GBP/USD 1.29-1.31 (bearish)
USD/CHF 1.00-1.02 (bullish)
Oil (WTI) 61.66-65.68 (bullish)
Gold 1 (bullish)
Copper 2.87-2.97 (neutral)
Best of luck out there this week,
KM
Keith R. McCullough
Chief Executive Officer