“Water keeps the boat afloat but can also sink it.”
-Chinese Proverb
That’s a good risk management quote to consider when you have a LOT of leverage during a growth slow-down. It’s also one Kyle Bass used in his recent Bloomberg Opinion article on what he thinks Trump should do with China.
I had the pleasure of a Real Conversation @HedgeyeTV with Kyle yesterday that I think you’ll find interesting (REPLAY: https://app.hedgeye.com/insights/74497-webcast-today-why-kyle-bass-sees-recession-risk-rising?type=macro).
Our discussion was multi-factor and multi-duration. Since the cyclical vs. secular debate on China is quite complex, I tried to center our conversation on GROWTH and LEVERAGE.
Back to the Global Macro Grind…
In sharp contrast to the US economic growth cycle that we just saw #accelerate for a record 9 CONSECUTIVE quarters to its Q3 of 2018 year-over-year US GDP growth cycle peak:
- China’s economy started #slowing (in year-over-year rate of change terms) in Q2 of 2017
- China entered Quad 4 in Q2 of 2017 and remained in Quad 3 or Quad 4 for 8 CONSECUTIVE quarters
- China’s GIP Model now-cast is implying Quad 2 in Q2 of 2019, breaking that ugly 8 quarter streak
Looking in the rear-view mirror, what Economic Quadrant a country was in is not subject to qualitative debate. Fully loaded with however the Chinese were making up their numbers, they reported #GrowthSlowing for 8 quarters in a row.
As a refresher for those of you who are new to our ROC (rate of change) measuring and mapping #process:
A) Quads 1 and 2 = #GrowthAccelerating
B) Quads 3 and 4 = #GrowthSlowing
And we call it our GIP (GROWTH, INFLATION, POLICY) Model because what Economic Quadrant (ROC of GROWTH and INFLATION) a country is in has a central tendency to perpetuate and proactively predict POLICY actions.
Here was China’s reported reality for the last year alone:
A) China was in Quad 4 for the last 2 quarters (and for 3 of the last 4)
B) Chinese stocks (Shanghai Composite) #crashed 31% from JAN 2018 to the JAN 2019 low
C) Chinese Policy went panic mode dovish during Quad 4 (again for the last 2 quarters)
Phew, thank goodness for ordering Chinese Cowbell!
But, as Bass put it quite simply to me yesterday, “the question is can the Chinese do it again?” It, as in centrally plan (stimulate) their way out of another slowdown…
They did it (big time) coming out of:
- 2008 and
- 2016
But there are some significant cyclical and secular differences between those 2 periods and 2019:
- USA was coming off the lows of The Cycle
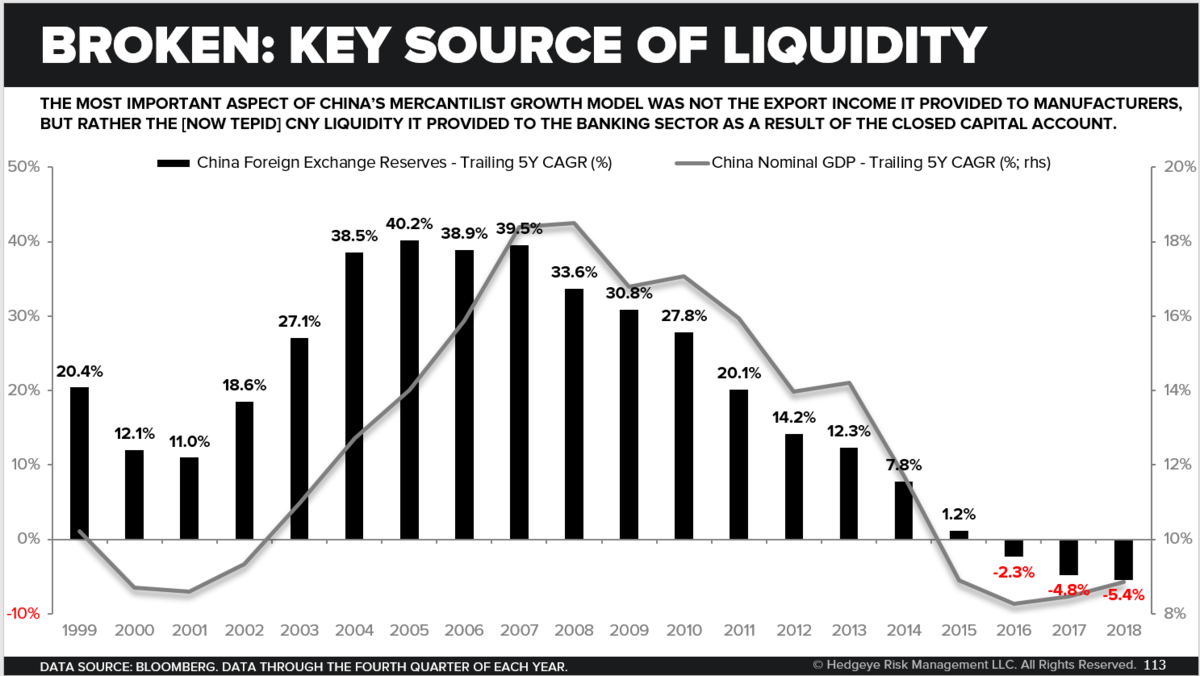
- China was running Current Account Surpluses
Today, as Bass articulated in our conversation:
A) China is running a Current Account DEFICIT…
B) With a CLOSED Capital Account …
C) That needs to be funded with both US Dollars and US Dollar Denominated Debt
But but, they had a solid PMI print last month… and the Shanghai Composite Index has broken out to Bullish @Hedgeye TREND. Yep, those are immediate to intermediate-term moves… and what Bass is concerned about is what comes AFTER those moves (i.e. what China’s economy is doing 6-12 months from now).
Personally, I don’t know what any economy is going to be doing 6-12 months from now. What I do know, with 100% certainty, is what the “comps” (year-over-year base effects for GROWTH and INFLATION) are going to be!
That’s what makes these longer-term secular discussions so interesting. If I have a bull and a bear, they can give me a lot to think about in terms of what could or “should” happen. That proactively prepares me for what I see as it is happening.
What are your answers to some of Kyle’s longer-term risk management questions?
A) Can China run Twin Deficits with a closed capital account and “do it again?”
B) Will almost $50 TRILLION in LEVERAGE in the Chinese banking system (3.8x GDP) matter?
C) If the US economy continues to slow post a short-term “trade deal”, what will the world do?
Not knowing the specific “timing” of these risks is what it always is. At first they happen slowly, then all at once. Or they don’t ever manifest at all. God willing we’ll be measuring and mapping it all as best we can in real-time.
Our immediate-term Global Macro Risk Ranges (with intermediate-term TREND signals in brackets) are now:
UST 10yr Yield 2.35-2.56% (bearish)
SPX 2 (bullish)
RUT 1 (bearish)
NASDAQ 7 (bullish)
Energy (XLE) 65.08-68.31 (bullish)
Shanghai Comp 3054-3326 (bullish)
VIX 12.40-16.24 (bearish)
USD 95.75-97.37 (neutral)
Oil (WTI) 59.66-64.97 (bullish)
Gold 1 (bullish)
Copper 2.84-2.96 (bullish)
Best of luck out there today,
KM
Keith R. McCullough
Chief Executive Officer