Editor's Note: Below is a chart and brief excerpt from today's Early Look written by Macro analyst Christian Drake. Click here to learn more.
|
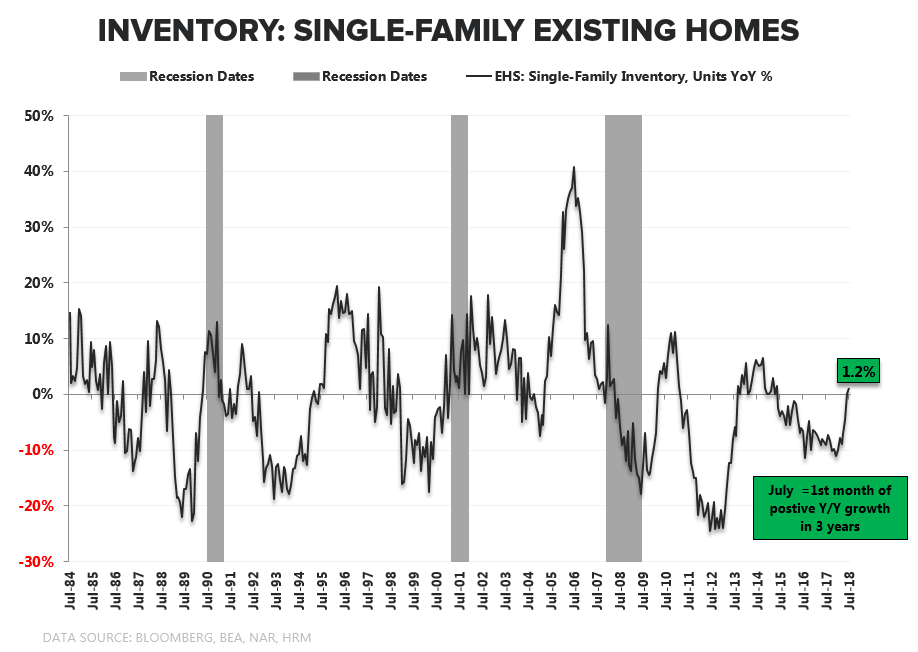
The biggest notable in the July release, however, was actually a (marginal) positive. Year-over-year unit inventory growth improved to +0% year-over-year, marking a 4th month of 2nd derivative improvement and ending a remarkable 37-month stretch of negative year-over-year growth (recall, while sales data is seasonally adjusted the inventory data is not so the y/y change offers a cleaner read on the underlying trend). Moreover, if we restrict the sample to detached single-family homes (i.e. ex-condos & co-ops), unit inventory growth accelerated to +1.2% Y/Y. This, of course, matters because all-time tight supply conditions have acted as the primary gating factor on volume growth. And while neither the absolute level of unit inventory nor the current months-supply level will serve to support a material change in volume growth nearer-term, from a better/worse perspective, the trending slope of the data has been conspicuously better. |