
TREND WATCH
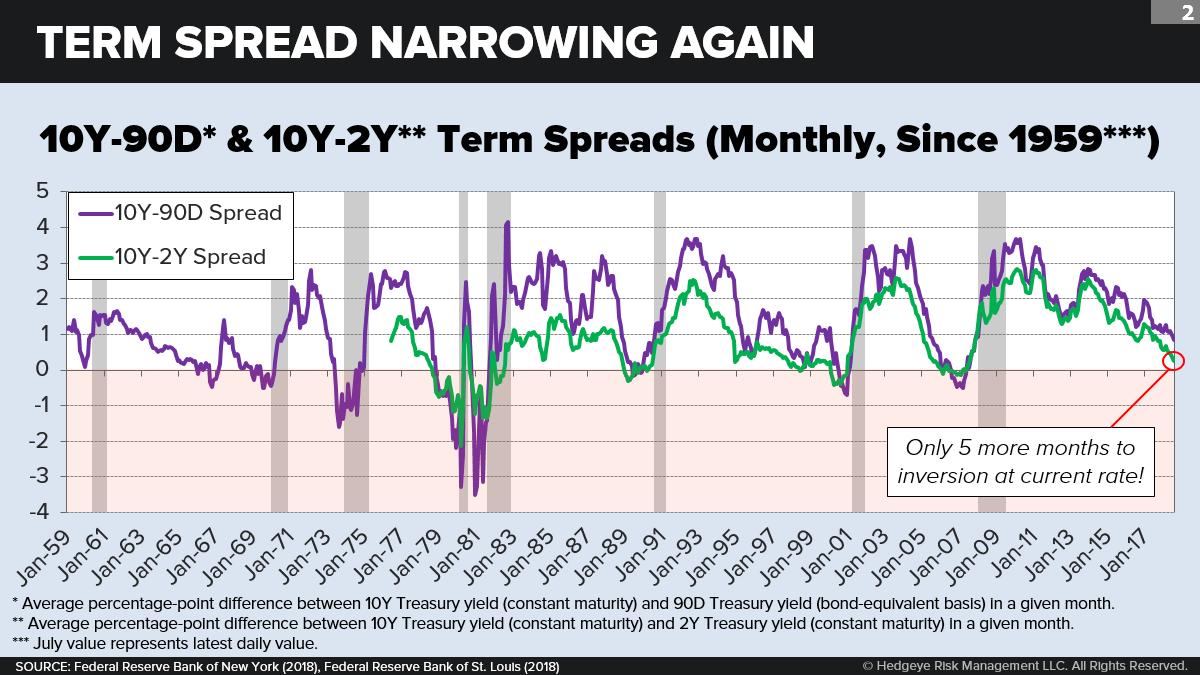
Is a U.S. recession imminent? That may depend on what you mean by “imminent.” The term spread between 10Y and 2Y Treasuries is rapidly shrinking—and is on pace to enter negative territory by Christmas of this year if its trajectory over the last 18 months continues. Such an inversion would spell trouble for the U.S. economy because the term spread is one of the most trustworthy of all leading indicators. The term spread encompasses a wide range of business-cycle dynamics that together offer up a complete picture of the economy. With the Federal Reserve committed to its rate-hike playbook, we could be heading for an inversion—and a subsequent economic downturn.

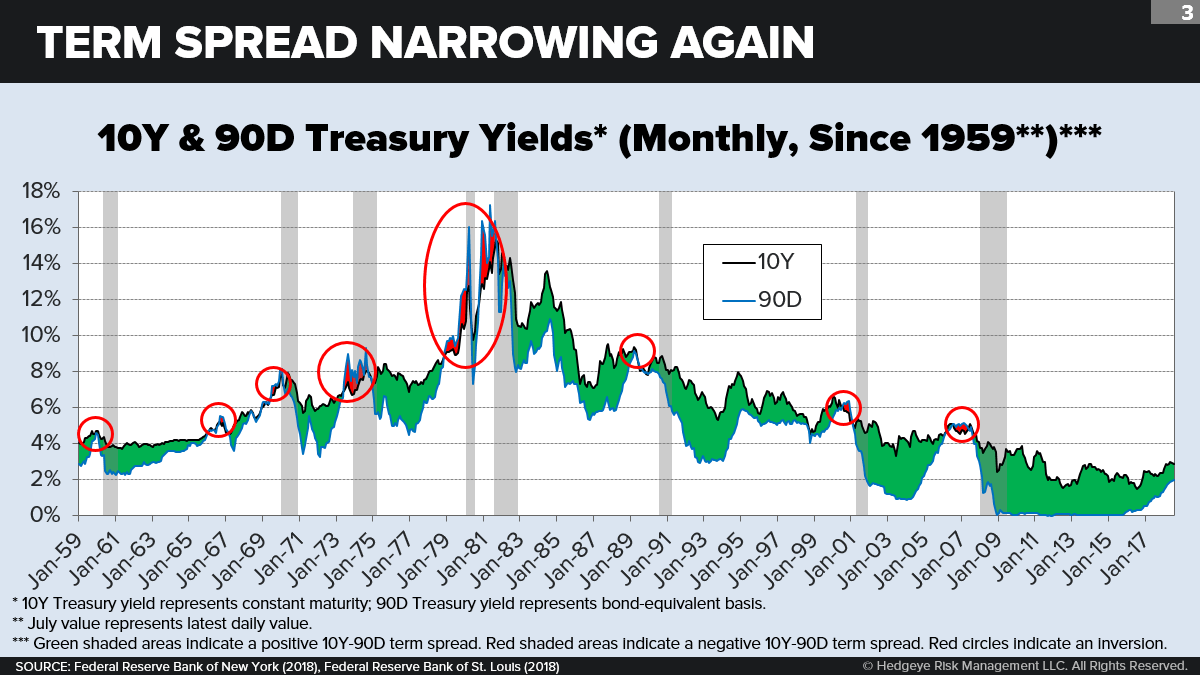
Economists and academics have been studying the relationship between the yield curve and the business cycle since the LBJ administration. In 1965, University of Chicago economist Reuben A. Kessel became one of the first to tie term spreads to phases of the business cycle. More recently, in 1998, researchers Arturo Estrella and Frederic S. Mishkin found that the 10Y-90D term spread performed better than any other indicator at signaling future recessions. The Federal Reserve Bank of New York even publishes a model that uses the 10Y-90D spread to predict the likelihood of a recession occurring within the next 12 months.
There’s a reason why forecasters are in love with the term spread: Historically, this variable has been an almost flawless recession indicator. Researchers at the Federal Reserve Bank of San Francisco noted in March that every U.S. recession since 1955 has been preceded by a negative 10Y-1Y term spread. They also noted the single false positive in 1967. The rule appears to hold even when substituting 1Y Treasuries for 90D or 2Y Treasuries.
But, as it turns out, the term spread is useful not just as a recession indicator. It is also a superior leading indicator of future GDP growth. In 1988, Robert D. Laurent compared the term spread between 20Y Treasuries and the federal funds rate with three other leading indicators and found that the spread would have been the best at forecasting near-term real GNP growth. We tested this idea ourselves by comparing the 10Y-90D term spread with future GDP growth. Going back to 1959, we see that the term spread decently tracks the 6Q-forward GDP growth rate, both in direction and magnitude. This relationship puts to rest at least one big criticism levied against the term spread—that it is not informative until it turns negative.

Why does the term spread work as a leading indicator? Because it takes into account a wide array of business-cycle dynamics—everything from central bank policy-setting, the timing of firm capex, and bank lending to consumer sentiment and rational investor expectations about the future.
Monetary policy is the most direct and obvious driver of the yield curve cycle. Going into a recession, the central bank dramatically lowers short-term rates to ensure that commercial banks remain liquid and consumers remain inclined to spend. Conversely, when the economy is running hot, the central bank hikes short-term rates to curb aggregate demand and thereby stay ahead of inflation. The long end of the yield curve is mostly driven by investor expectations stretching far beyond the current phase of the business cycle. The short end, however, is closely riveted to the Fed’s interest-rate target (typically, the federal funds rate).

Real economic activity has an additive effect on the yield curve. Over the course of the business cycle, the national savings rate rises. When the economy just emerges from a recession, there are lots of borrowers—households, firms, and (especially) the federal government—and not many savers. This props up the long end of the curve while the short end is held low by the Fed. But all this reverses late in the business cycle, when there are more savers and fewer borrowers, when employment and production are decelerating, and when long-term financing seems a lot more expensive.
Commercial banks also figure heavily in the dynamics of the yield curve. These institutions are in the business of “maturity transformation”—taking short-term credit and transforming it into long-term loans. The more dramatic the upward slope of the yield curve, the more profitable this business is. But near the end of the business cycle as the yield spread flattens and ultimately inverts, the industry’s net interest margin gets squeezed. Soon, banks are paying out more in interest on short-term loans than they are receiving in interest on long-term loans. This eliminates the incentive to lend, which suppresses economic activity.
Finally, let’s look at speculation, which both amplifies the term-spread cycle and accelerates its timing. This is in some ways the most decisive force, because global speculators have bottomless pockets when they sense they can make a sure duration bet.
What’s the rationale for this sure bet? It comes from traders knowing or at least sensing where they are in the business cycle. When traders think that a recession has just passed and the worst is over—and that the entire yield curve is about to start rising—they will short the far end and park their extra money in the near end. They will simultaneously make money while steepening the curve. Likewise, when they think that an expansion is getting old and the best is over—and that the entire yield curve is about to start sinking—they will go long the far end and avoid the near end. They will make money while helping to flatten or invert the curve.

The Fed is standing at a crossroads. Path One is to stay ahead of inflation by hiking short-term rates—even if it hastens the arrival of the next downturn. Path Two is to avoid a yield curve inversion by delaying rate hikes, or even reversing them, in an effort to stave off the next downturn.
Given the term spread’s perfect history as a recession predictor, Path Two seems the reasonable course. But the Fed appears committed to Path One. Why? It is one thing to be blamed for helping to trigger the next recession by attempting to get out in front of quickening inflation. It is quite another to be blamed for unleashing accelerating inflation expectations that could require excruciating monetary medicine, including perhaps a severe downturn and years of structural damage to the economy. Fed officials are long-term, cost-benefit pragmatists. In their view, sometimes the risk of recession is the necessary price you pay for keeping inflation in check; without paying this price, the next recession could be far more severe.
This situation isn’t unsalvageable for equity investors. A recent BMO Capital Markets analysis shows that stocks can still perform well in the flattening phase of the yield curve. But the real opportunity is clear. Once the curve fully inverts, you want to be long in long bonds. And you want to start battening down the hatches on everything else.
TAKEAWAYS
- One of our most storied leading economic indicators is flashing yellow. The spread between long- and short-term bond yields has hit its narrowest point since the summer of 2007. A few more hikes of the fed funds rate will send the term spread into negative territory, a scenario which has preceded each recession in the postwar era. The term spread works as a leading indicator because it captures a rich variety of business-cycle dynamics all in one. All eyes are now on the Federal Reserve, whose growing inflation hawkishness may be locking it into a rate-hike playbook that does indeed invert the curve and send us into the next recession.
- The term spread stacks up well against other leading indicators. Unlike most other indicators, which hinge on monthly or even quarterly data, the term spread is real time, context-agnostic, and highly accurate. But how does it compare to indicators with a higher pedigree? As it turns out, the term spread moves in lockstep with the consumer confidence spread (the difference between people’s future expectations and their perceived current condition), which is one of the most widely accepted leading indicators we have. The term spread is even more accurate than the 3-month average initial jobless claims—since jobless claims sometimes don’t begin rising on a YoY basis until well into a recession.
- Skeptical arguments don’t hold up to scrutiny. Not everyone believes that the term spread-recession relationship still holds true. Some say this time is different because the economy is still humming and rates are still low. Others say that the yield curve is flattening for “special” reasons including QE, global turmoil, big bond purchases by insurance companies, or the erosion of “term premia.” But analysts at the San Francisco Fed summarily dismissed many of these arguments, finding for instance that only the spread between rates—not the level of rates themselves—mattered for recession predictions.
- Game theory can help us understand the speculative mindset. As investors begin to sense that the Fed is locked into its inflation-fighting strategy, many are becoming more comfortable moving into long bonds even as inflation still heats up. If investors regarded the Fed as just another player, game theory suggests that they should be careful—since the Fed could always pull the rug out from under them before the inversion fully matures. But in this case, the game is asymmetrical: Investors pretty much know that the Fed can’t take that risk. It’s like a prisoner’s dilemma in which one person knows the other won’t bluff or snitch.
