
TREND WATCH
The U.S. housing market appears strong on the surface: Housing starts for January rose 9.7 percent YoY, prompting plenty of optimistic quotes from homebuilders and industry forecasters. But a longer-term look reveals something amiss: Annualized housing starts are barely halfway back to 2006’s peak. Housing starts, in fact, are now lower than at any previous business-cycle peak going back to President Truman. What’s going on? A slowdown in the growth rate of the adult population is one factor. The less obvious trend is behavioral: Today’s young adults are no longer in a rush to set out on their own—and their parents are no longer yearning for an empty nest. Barring a drastic reversal in this trend, the housing market will have to cope with the double whammy of slowing population growth and a growing preference for larger households.
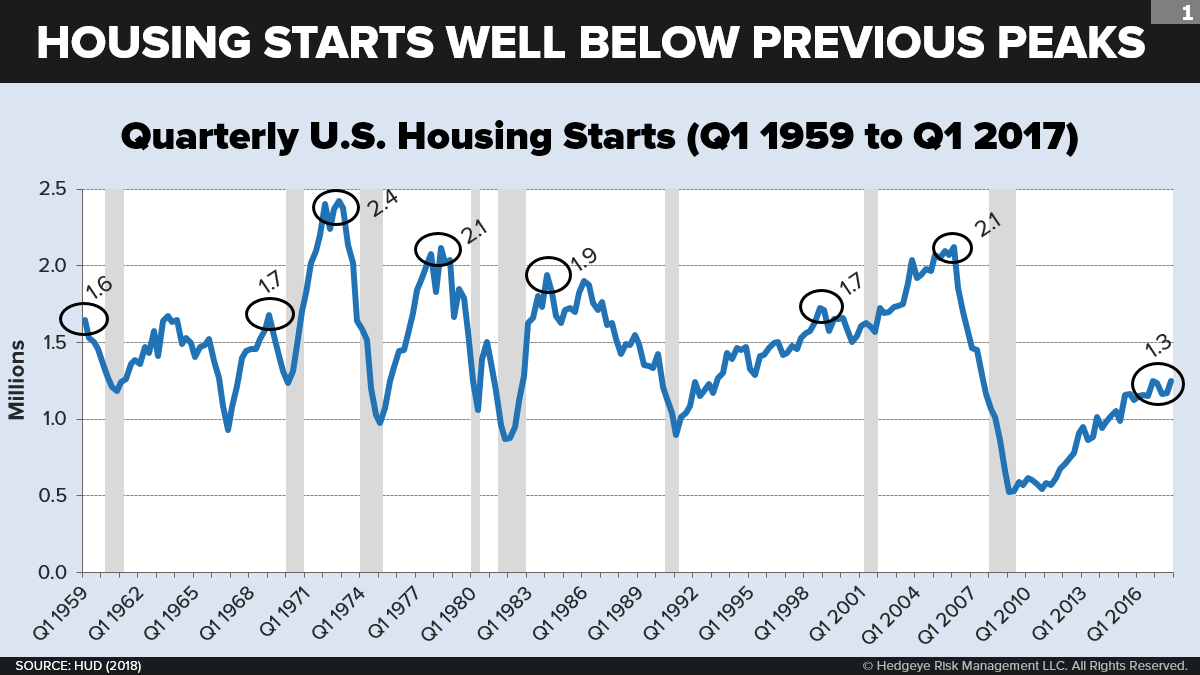
America remains mired in by far the weakest housing market of the postwar era. New housing starts over the last 12 months (calendar year 2017) weigh in at a SAAR of +1.2 million. That’s better than it has been recently. But it is barely half of where it stood at the peak of the last business cycle (Q1 2006: +2.1 million). And, in fact, it is lower than at the peak of any business cycle going back almost all the way to World War II. The current Census data series on housing units starts in 1959, but earlier data on the U.S. housing stock makes it clear that even the America of the 1950s outbuilt the America of the 2010s. What makes this truly remarkable is that America today has a much larger population than in those earlier decades. In 1972, for example, America built twice as many houses—even though our adult population back then was only 57% as large as it is today. In 1959, it was only 43% as large.
One widely recognized demographic driver behind this trend is the inexorable if halting decline in the growth rate of the adult population over the last several decades. America is a demographically mature society, with a gradually declining total fertility rate. This must lead, over time, to a similar decline in the number of new adults who come of age each year relative to the old adults who pass away each year. Of course, this decline was “put on hold” for roughly 30 years (1) as the large Boomer generation worked its way into and through adulthood. It has also been buffeted by immigration, which rose from the 1970s through the 2000s. But currently—with birthrates resuming their long-term decline, with Boomers entering their high-mortality age brackets, and with net immigration again falling—the falling trend is reasserting itself. U.N. population projections show the growth rate falling further through the next decade.
But the slowdown in the growth rate of U.S. adults cannot alone explain the decline in housing demand. Something else is going on—namely, a recent failure in the growth rate of households to keep up with the growth rate in adults. Arithmetically, this translates into a rise in the number of adults per household. The Great Recession undoubtedly played a part in incentivizing friends and families to “double up.” But the gap between adult population growth rates and household growth rates emerged well before 2008: Adult population growth has outpaced household growth in 10 of the 14 years since 2004. If it were up to population alone, there would be 2.2% more households than there are today—a figure that equates to nearly 3 million missing homes.

For most of the postwar era, the average number of adults per household was on a steep downward trajectory. In the 1950s and 1960s, the decline was ushered in by the spread of suburban single-home developments. Thus, the new “nuclear family” household (no grandparents, no relatives, no in-laws) was born. In the 1970s and 1980s, household size continued to decline, driven partly by the “going solo” lifestyles of a large new generation of young Boomers and also by the divorce revolution and the rise of “senior living” developments. During the 1990s and early ‘00s, the downward trend persisted, albeit at a much shallower trajectory—this time driven by falling mortgage interest rates and sizeable gains in real median family income. The all-time low in average household size (1.91 adults per household) was reached in 2001 and 2003. Ever since, the size has been gradually rising—to 1.95 in 2017.

What can explain the ongoing “re-crowding” of U.S. households? A massive shift toward the renewed desirability of group lifestyles—which has been driven mostly by generational change. The biggest driver is the coming of age of Millennials, who are much more accepting (than Boomers or Xers were at the same age) of living with their parents and with each other. Additionally, Boomers are much more willing to allow or invite their adult children to live with them than the midlife Silent or G.I.s were with their own adult children. (See: “Does Co-Living Threaten the U.S. Housing Market?”) Of course, not all social and generational changes are pushing in the direction of larger households. But the opposing forces are clearly losing.
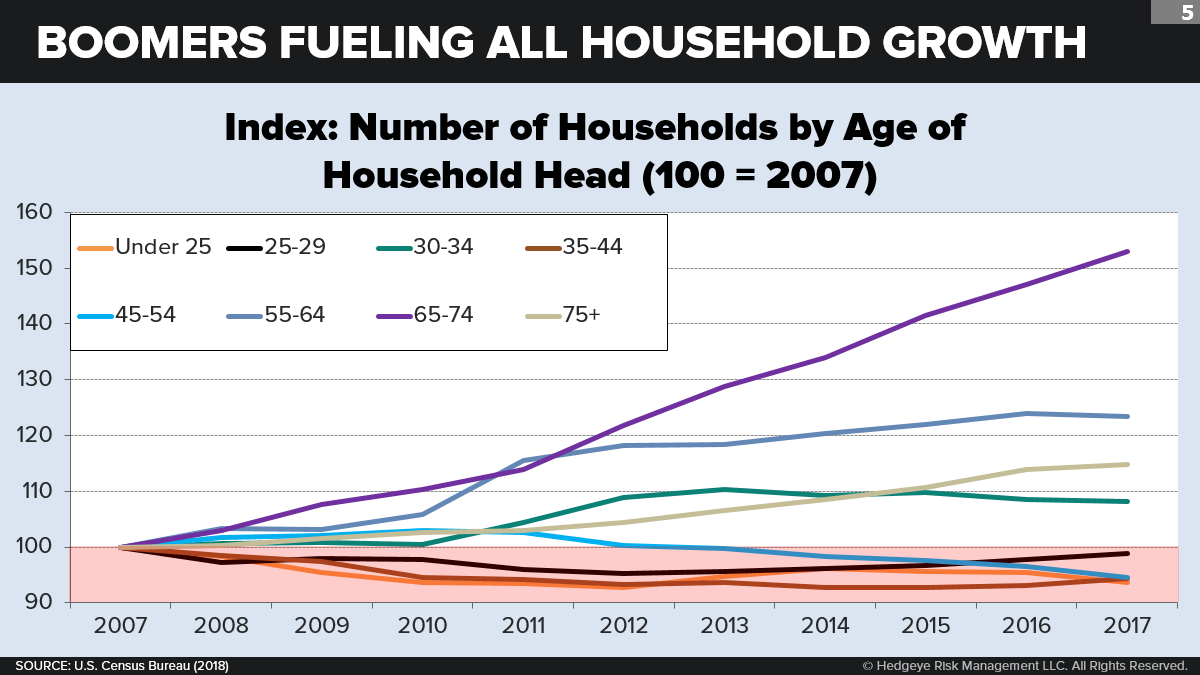
The quantitative effect of this behavioral shift is immense. Since 2007, nearly 1.9 million households have been lost, cumulatively, due to more adults living together. That’s 190,000 fewer new households, every year, over the past decade. Millennials are the biggest contributors to this downdraft. If we were looking just at population numbers, 25- to 34-year-olds should have added 2.1 million homes from 2007 to 2017; instead, they added fewer than 700,000. The same trend holds true (to a lesser quantitative effect) for 18- to 24-year-olds. So much for a huge new Millennial housing wave that was supposed to power the entire market. (See: “The Millennial Housing Wave: For Real?”) So who has kept the housing market afloat? The 55+ crowd. Thanks to the sheer dint of Boomer numbers—combined with the negative behavioral shifts in younger age brackets—Americans age 55 to 74 are responsible for more than the entire growth in household formation over the past decade: They’ve accounted for 11.8 million new households, compared to the 10.3 million new households created by all Americans.

What’s in store for the housing market? Since the overall growth rate in the adult population is projected to slow between 2017 and 2030, the next decade is likely to see a continuing slowdown in the demand for net new housing units. Consider that, even if recent bearish behavioral trends cease completely and household growth is fully powered by population growth (a best-case scenario), we will still see just under 1 million households added annually by 2030—less than today. If, on the other hand, behavior changes continue to raise the average household size, the outlook will get even darker.

TAKEAWAYS
- The U.S. housing market is weaker than it appears. Despite growth in existing home sales and new home construction, housing starts remain at historically low levels: They’re barely halfway back to 2006’s peak, and they’re lower than at any previous business-cycle peak going back to World War II. A slowdown in the adult population growth rate is one contributor, but this doesn’t account for the entire downdraft. The less obvious trend is behavioral: After decades of decline, average household size is on the rise, a trend fueled by new generational attitudes. Barring a drastic behavioral shift, housing will have to cope with sustained low demand for years to come.
- The recent renaissance in extended family living has many components. The most quantitatively important has been a rising willingness among young adults to live with their midlife parents or other older relatives (and vice versa). Millennials are also more inclined to live with friends than previous generations of young adults, a function of this generation’s sociability and low marriage rates. Older adults aren’t left out of the equation: In addition to being more willing to host their kids, older adults today are more likely to choose to live with like-aged relatives or friends. Finally, relatively higher male life expectancy is reducing the share of senior widows who live alone.
- Home remodeling and improvement is a beneficiary of the housing slowdown. While weaker demand for new homes is bad news for homebuilders, it is good news for firms that cater to homeowners who want to stay put. Harvard University’s Joint Center for Housing Studies projects that U.S. home improvement spending will reach a record-high $339 billion in Q4 2018. Home Depot’s latest earnings report surprised heavily on the upside, with same-store sales rising 7.5 percent YoY in Q4 2017. As we’ve mentioned before (see: “Home Remodeling Flexes Its Muscles”), the biggest driver has been generational: Affluent Boomers who want to stay in their “forever homes” are spending heavily on improvements and renovations.
- To be sure, the future of housing is not written in stone. On the demographic side, the “natural growth” components of adult population change can be forecast with great accuracy. But immigration is a wild card: If immigration were to climb way above its recent trend, that would have a significant positive impact on housing. The other wild card, of course, is behavior. If you believe that Millennials—despite recent evidence after an eight-year economic recovery—are still a coiled spring of loners just yearning to set out on their own, then yes, this too could turn a headwind into a tailwind. But that’s a bet you need to make at your own risk.
