

Sales and profit growth are accelerating.
We're not sure what it says about the current, collective investor psyche that we feel obliged to explicitly highlight that hard data reality but, hey, you play the game that you’re in.
To be sure, we’re comping against an industrial and profit recession whose base effect benefit will diminish as we move past 1H17 and Staples & Telco results have been modestly underwhelming but, viewed comprehensively, that’s kind of like complaining about the production quality in one scene in Game of Thrones.
A positive 2nd derivative is the trending fundamental actuality.
Anyway, with ~60% of SPX constituents having reported here’s how the corporate profit reflation is trending. Immediately below is a bullet point summary, more detailed context follows:
- Growth: Earnings growth in all three of the major U.S. benchmark indices is up at least 15% Y/Y, marking the best RoC figures since 2011
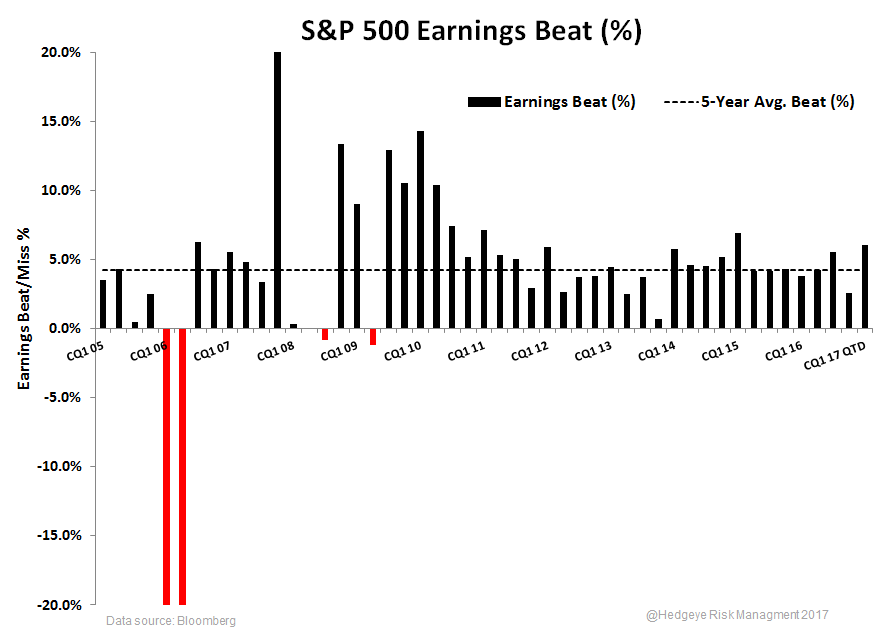
- Beat %: Across the S&P500, the magnitude of earnings surprises is at its widest since 1Q15.
- Revision Trend: For a 2nd quarter in a row intra-quarter revision trends have not been negative. In other words, the start high --> progressively lower estimates --> beat troughed out expectations pattern has failed to manifest for a 2nd consecutive quarter.
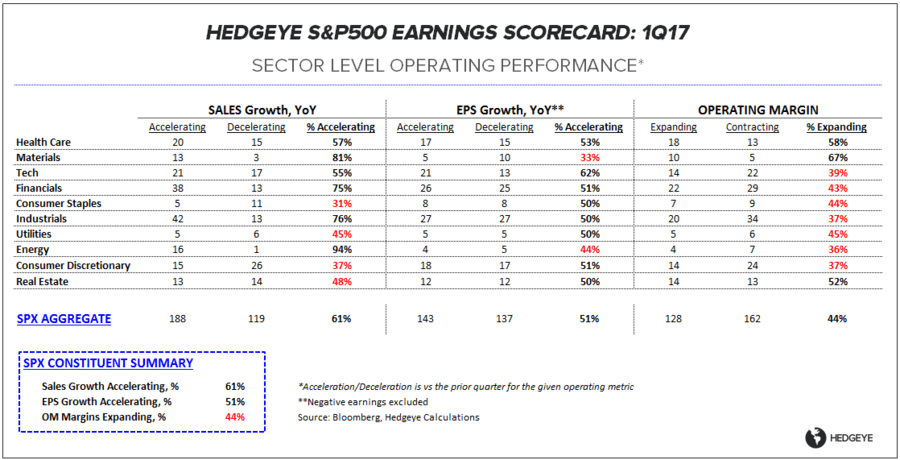
- Operating Momentum: 61% of companies have reported a sequential acceleration in sales growth, a multi-year high.
- Reflation’s Rollover : we continue to expect Reflation’s Rollover (2Q Macro theme) to manifest across reflation and commodity linked equity exposures and continue to like real growth leverage.
Breakdown of Growth Rates
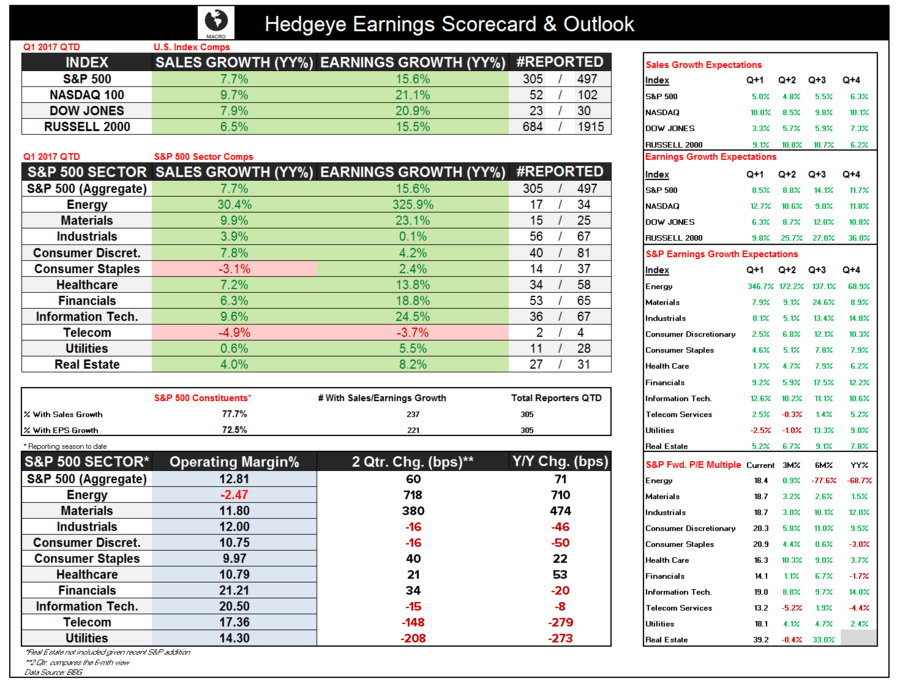
With 305 companies in the S&P 500 having reported this earnings season to date, sales and earnings growth are tracking +7.7% and +15.6% YoY, respectively, with the most positive growth rates (outside of energy) in the technology and materials sectors.
Should earnings growth finish reporting season at current tracking rates, Q1 of 2017 will mark the steepest Y/Y growth period since Q1 of 2011 for both information technology and the S&P 500 on the whole. Also with the conclusion of earnings season the 2-yr comp rate will be squarely back in positive territory for the S&P 500.
Turning to the Nasdaq 100, earnings growth is tracking +21.1% Y/Y for Q1. Propelled by the technology subsector, 22/40 constituents have reported earnings growth of nearly 31%. The smallest categorical component (based on # of companies) within the technology subsector, hardware and equipment, has contributed disproportionately thus far, but Apple earnings will smooth out subsector earnings growth.


Results vs. Expectations
Aside from actual growth rates, Q1 EPS beat rates (actual numbers vs. BBG consensus estimates) have also inflected positively. S&P 500 earnings growth has beat Y/Y estimates by 6.8%, marking the widest gap between actuals and expectations since Q1 of 2015. Aside from 1Q15 and immediate post-recession comps, the positive spread in 1Q17 is the widest of the cycle.
On average, S&P 500 aggregate earnings growth has beat estimates by 4.3% over the last 5 years and 5.4% if you include the full cycle. Reporting season to date, 7 of 10 S&P 500 sectors (excluding Real Estate) have experienced a wider than average gap in earnings growth vs. estimates. Earnings season has likely been a boon to consumer discretionary constituents. A relative sector outperformer, earnings growth has outpaced estimates by 12.5% (40/81 reported in the S&P 500). The last time the actual earnings to estimates gap has been this wide in consumer discretionary was in Q3 2010 (on top of a recessionary base).

Revision Trends
The typical progression of revision trends is widely known. Forward estimates which are too optimistic get revised progressively lower throughout the quarter, and earnings then beat estimates. The last two quarters, however, earnings estimates have been only slightly revised throughout the calendar quarter (first day to last day), which adds marginal strength to overall growth and beat trends.
Omitting Q1 of 2009, the average intra-quarter EPS revision for the S&P 500 has been -1.0% this cycle. In Q4 of 2016 and Q1 of 2017, the S&P 500 EPS estimate (next 4-qtr) has been revised by just -5bps and -10bps respectively. Steadily climbing NTM EPS estimates over the last year have kept the market’s forward multiple off the cycle-highs.
An interesting dynamic with regard to NTM revision trends throughout 2017 is that energy, technology, and financials have pushed the S&P 500 aggregate estimate higher while other sector EPS revision growth undershot the S&P 500 – revisions in those three sectors have greatly outpaced the others in 2017. With that being said, NTM EPS revisions have increased in all but two sectors: Healthcare and Telecom (Telecom is currently on the YTD low mark for NTM estimates).


Christian B. Drake
@HedgeyeUSA
Ben Ryan
dty
