

Three key callouts from Nike's 10Q. 1. Regional inventory trends -- US getting better. 2. Quantification of consolidated GM puts and takes. 3. Regional GM trends (which we synch w inventories in Regional SIGMAs). The punchline is that the North America inventory correction stands out above all as a bullish datapoint. With the hyperfocus on Nike's US business, this matters.
Nike 10Q – Regional SIGMA Callouts and GM Disclosure
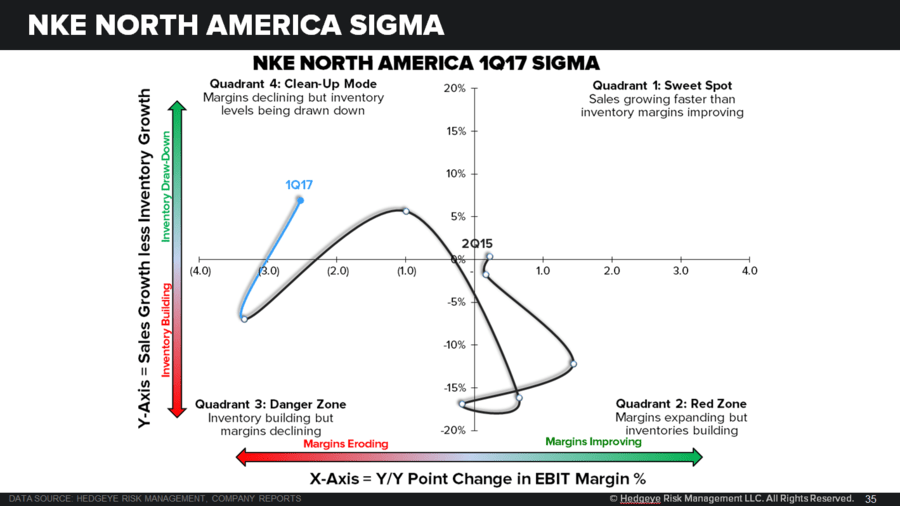
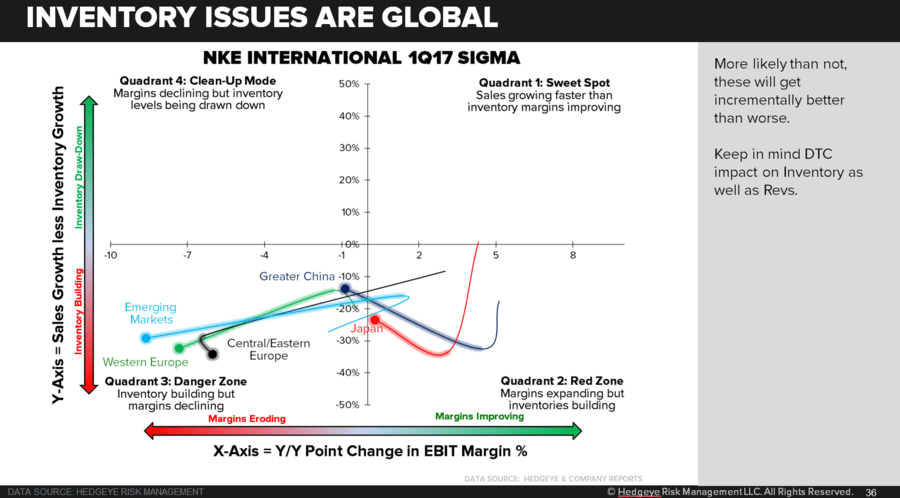
a. The key thing we like to do when Nike files its Q is to get the full inventory, sales and margin disclosure for each of its regions. The SIGMA chart for all pieces of the Global portfolio are in the chart below.
Simply put…
- The US took a tremendous positive move into the ‘inventory clearance’ quadrant.
- With that SIGMA clean up in NA, gross margins were down 90bps, as lower product costs were more than offset by the negative impact of clearing inventory.
- Asia looks incrementally better.
- Europe and Emerging Markets look horrible.
b. NKE 1Q Gross Margin Breakdown: GM % was down 200bps yy
- ASP: +60bps
- Product Costs: -40bps
- Increased off price sales: -30bps
- Lower DTC margins via higher factory store sales: -30bps
- FX: -40bps
- Higher Other Costs (investments in sourcing, manufacturing resources, warehousing, logistics, and Golf Equipment exit costs): -80bps
Note: this sums to -160bps, perhaps implying the cost shift from SG&A accounts for the remaining ~40bps – smaller than we initially suspected.
c. Gross Margin By Region:
- NA: -90bps, lower costs offset by clearing inventories
- W Europe: -630bps, higher asp offset by fx
- E Europe: -890bps, FX hit, higher product costs, partially offset by higher asp
- China: -210bps, higher ASP, offset by higher product costs and FX
- Japan: -240bps, lower product costs offset by FX and lower DTC margins
- Emerging Markets: -350bps, FX hit and higher product costs, offset by ASP increases
