

With the VIX in solid uptrend and having broken to new highs (on higher lows as well), the panic line of 40 is in sight. We focus on equity trading volume this week and the simple linear association of the 50 day moving average of NYSE total stock volume and the volatility index. Higher vol means more investors lining up at the exchange to move exposure around. Separately, the CME Group announced new all time highs in WTI crude oil trading which continues to build up earnings for the first quarter. With energy trading averaging a rate per contract of over $1.20, incremental volume from crude adds solid earnings power considering the blended average CME rate per contract is $0.79 for all products.

Weekly Activity Wrap Up
1Q16TD average daily volumes (ADVs) rose in all three categories this week as volatility picked up. Cash equity volume for the week came in at 10.1 billion shares traded per day, bringing the 1Q16TD ADV to 9.4 billion, up +36% Y/Y. Futures activity at CME and ICE came in at 28.9 million contracts traded per day this week, bringing the 1Q16TD ADV to 25.0 million, up +25% Y/Y. Additionally, CME is currently at an all-time high in open interest of 116.0 million contracts, which should push volume higher going forward. Options came in with 18.7 million contracts traded per day, bringing the 1Q16TD ADV to 18.7 million, up +20% Y/Y growth.

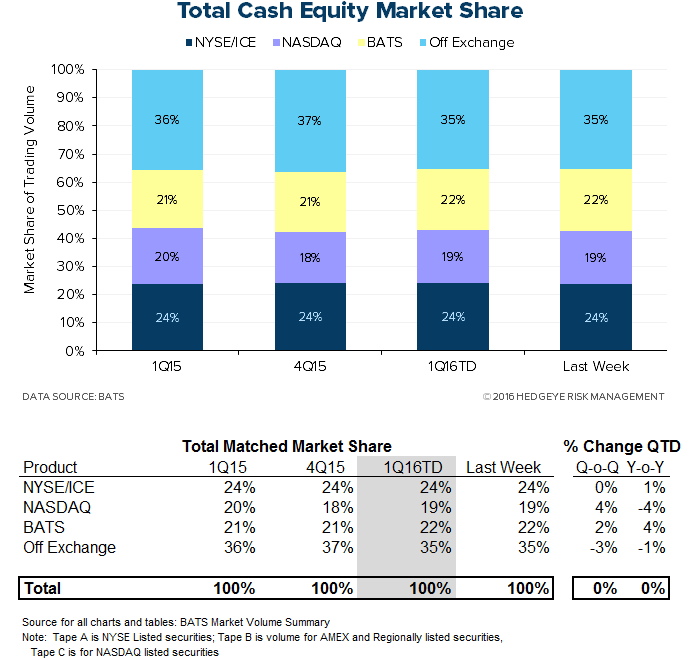
U.S. Cash Equity Detail
U.S. cash equities trading came in at 10.1 billion shares per day this week, bringing the 1Q16TD average to 9.4 billion shares per day. That marks +36% Y/Y and +34% Q/Q growth. The market share battle for volume is mixed. The New York Stock Exchange/ICE is taking a 24% share of first-quarter volume, which is consistent with the prior quarter and year-ago quarter, while NASDAQ is taking a 19% share, +65 bps higher Q/Q but -83 bps lower than one year ago.

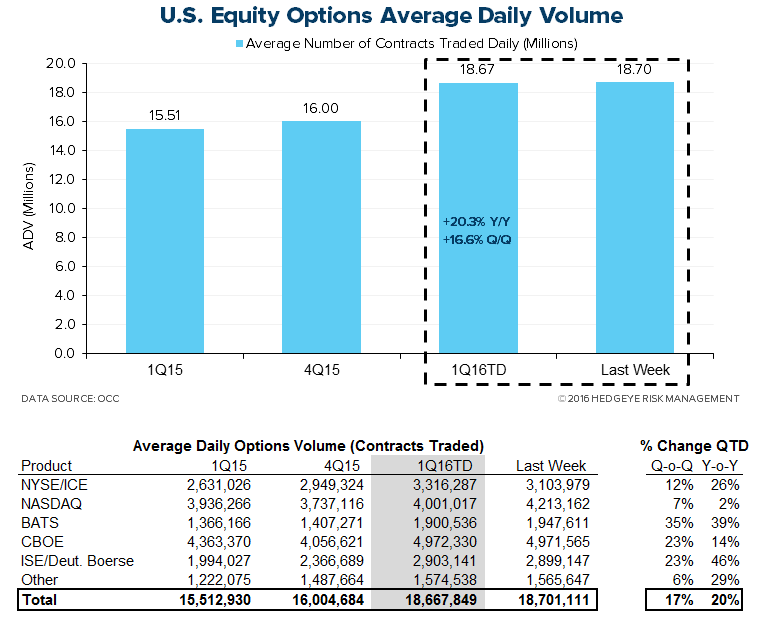
U.S. Options Detail
U.S. options activity came in at an 18.7 million ADV this week, bringing the 1Q16TD average to 18.7 million, a +20% Y/Y and +17% Q/Q expansion. In the market share battle amongst venues, NYSE/ICE has been trending downward at a moderate pace, but at an 18% share it is +80 bps higher than the year-ago quarter. Meanwhile, NASDAQ's recent declines bring it -394 bps lower than 1Q15. CBOE's market share is down -149 bps Y/Y but has improved recently; its 27% share of 1Q16TD volume is up +129 bps from 4Q15. BATS and ISE/Deutsche have been taking share from the competing exchanges, with BATS up to a 10% share from 9% a year ago and ISE/Deutsche taking 16%, up from 13% a year ago.

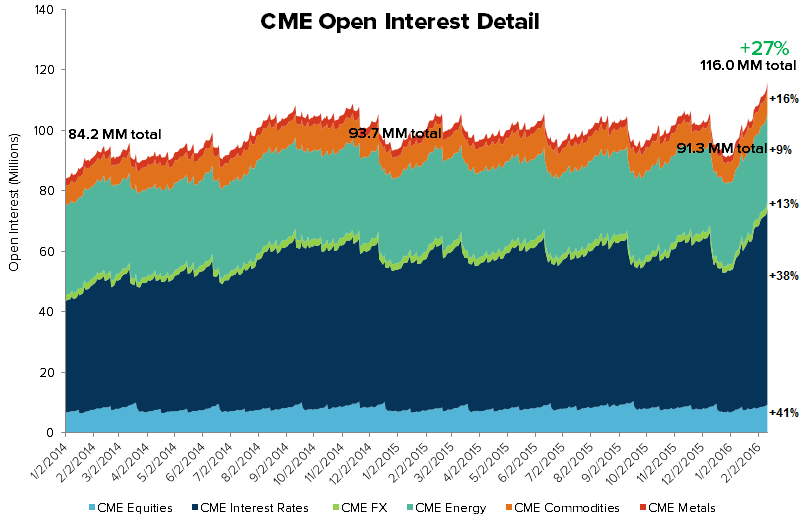
U.S. Futures Detail
22.3 million futures contracts traded through CME Group this week, bringing the 1Q16TD average to 18.8 million, a +26% Y/Y and +43% Q/Q expansion. Additionally, CME open interest, the most important beacon of forward activity, currently sits at an all-time high of 116.0 million CME contracts pending, good for +27% growth over the 91.3 million pending at the end of 4Q15, an improvement from last week's +22%.
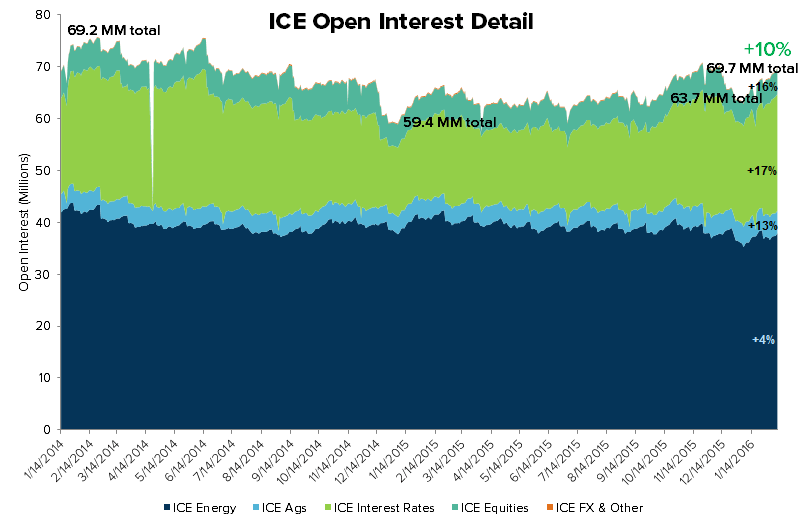
Contracts traded through ICE came in at 6.6 million per day this week, bringing the 1Q16TD ADV to 6.2 million, +23% Y/Y and +29% Q/Q growth. ICE open interest this week tallied 69.7 million contracts, a +10% expansion versus the 63.7 million contracts open at the end of 4Q15, an improvement from +7% last week.


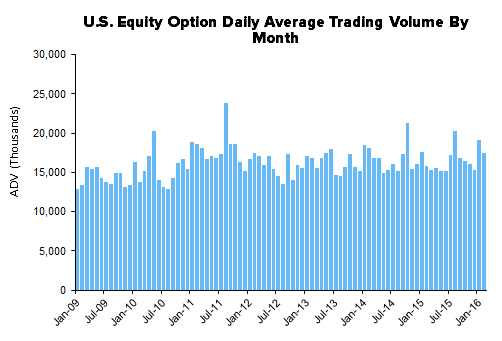
Monthly Historical View
Monthly activity levels give a broader perspective of exchange based trends. As volatility levels, measured by the VIX, MOVE, and FX Vol should rise to normal levels after the drastic compression this cycle, we expect all marketplaces to experience higher activity levels.


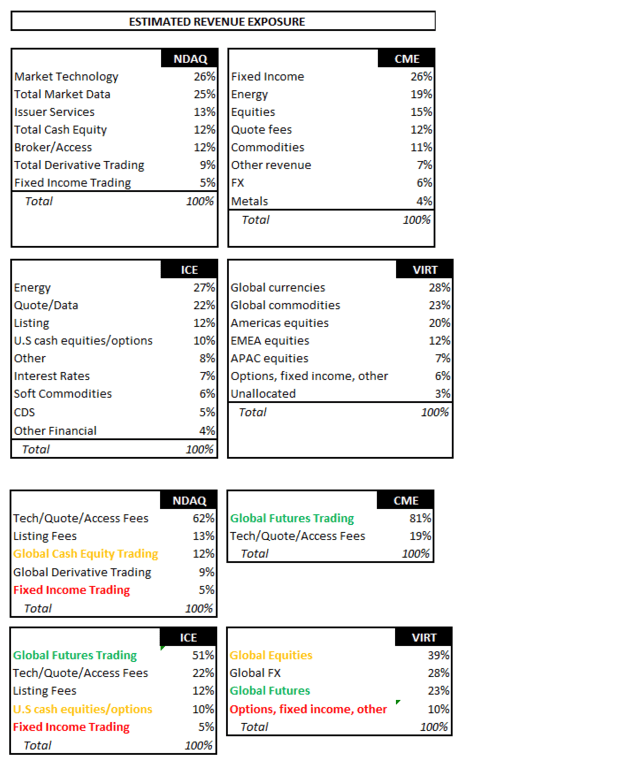
Sector Revenue Exposure
The exchange sector has broadly diversified its revenue exposure over 10 years as public entities with varying top line sensitivity to the enclosed trading volume data. The table below highlights how trading volumes will flow through the various operating models at NASDAQ, CME Group, ICE, and Virtu:
Please let us know of any questions,
Jonathan Casteleyn, CFA, CMT
Joshua Steiner, CFA
