

Our Hedgeye Housing Compendium table (below) aspires to present the state of the housing market in a visually-friendly format that takes about 30 seconds to consume.
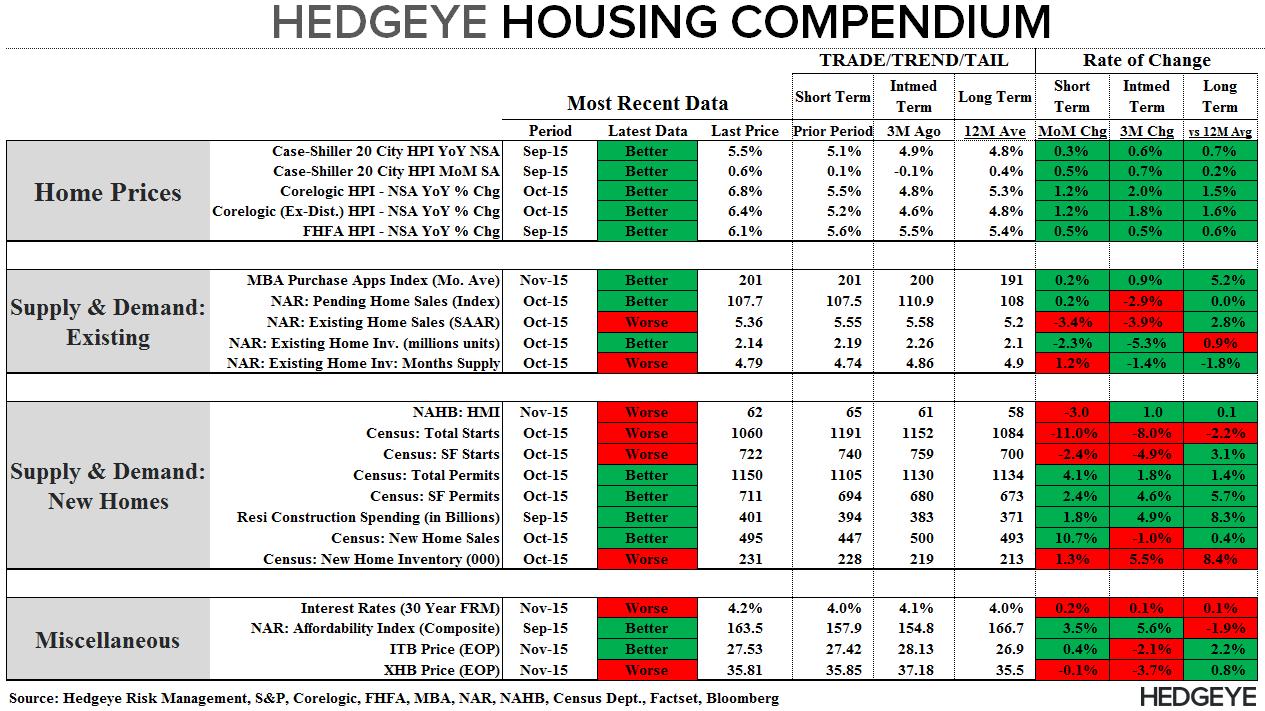
Today's Focus: October CoreLogic Home Price Report
WHY: Historically, the 2nd derivative trend in home price growth has shown a strong direct relationship with equity performance across the housing complex and across builders in particular. A primary reason is that accelerating price growth effectively gets captured in land values, raising the value of lots in inventory with that margin capture dropping through the P&L and augmenting profitability.
WHEN: After peaking in early 2014, price growth decelerated discretely through 2014 year-end. Along with the tail impact of rising rates (2013 Taper Tantrum) and the Peak in regulatory tightening (QM implementation, Jan 1014), negative price growth trends drove significant underperformance in housing equities through the first 3-quarters of 2014. Price growth subsequently stabilized and accelerated modestly in 1Q 2015 which, along with positive seasonality and easy volume comps, drove marked outperformance for the group.
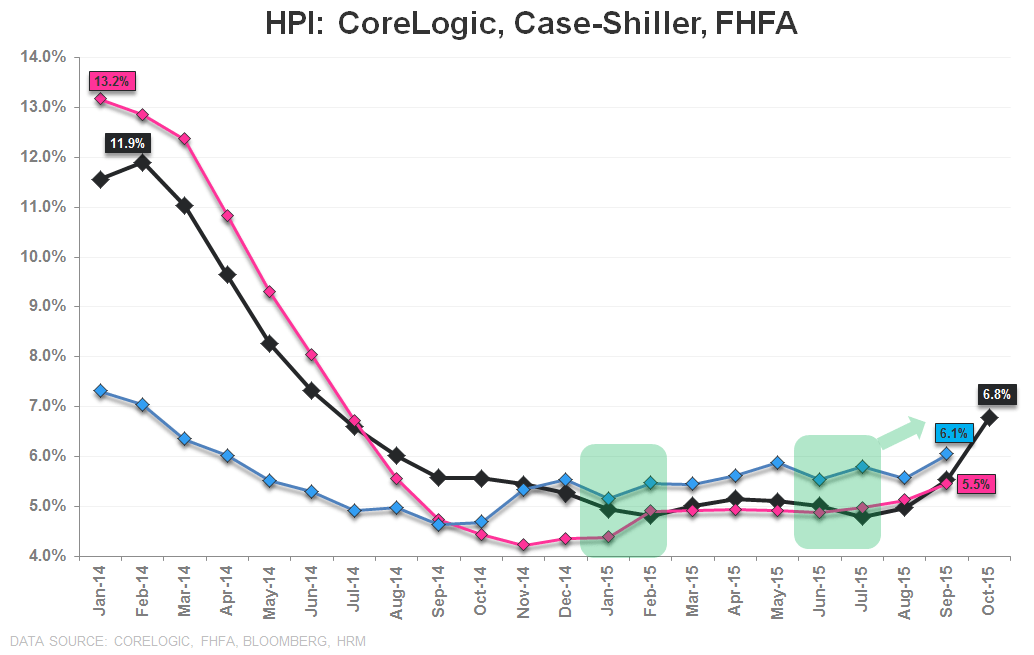
WHAT: As the 1st chart below illustrates, price growth across all three primary HPI series is again showing modest acceleration the last couple/few months – a largely unsurprising development given the ongoing, crawling improvement in demand, continued supply tightness, and prices' lagged relationship with demand.
From here, it’s more likely we see some stabilization in price trends rather than another iteration of the large-scale inflections (i.e. +/- 15% YoY) that have characterized the post-crisis period to-date but, as it stands, HPI trends remain a moderate tailwind supporting the complex.


About CoreLogic:
CoreLogic HPI incorporates more than 30 years worth of repeat sales transactions, representing more than 55 million observations sourced from CoreLogic's property information database. The CoreLogic HPI provides a multi-tier market evaluation based on price, time between sales, property type, loan type (conforming vs. nonconforming), and distressed sales. The CoreLogic HPI is a repeat-sales index that tracks increases and decreases in sales prices for the same homes over time, which provides a more accurate constant-quality view of pricing trends than basing analysis on all home sales. The CoreLogic HPI covers 6,208 ZIP codes (58 percent of total U.S. population), 572 Core Based Statistical Areas (85 percent of total U.S. population) and 1,027 counties (82 percent of total U.S. population) located in all 50 states and the District of Columbia."
Joshua Steiner, CFA
Christian B. Drake
