


Key Takeaway:
Last week was a relatively quiet one on the global macro risk front. That said, the intermediate term setup remains tilted toward the negative with a 3 to 1 ratio of red to green. Bigger picture, the overarching reality is that the environment is decidedly late cycle, and more and more data points are emerging in support of that conclusion.
Current Ideas:

Financial Risk Monitor Summary
• Short-term(WoW): Positive / 1 of 12 improved / 0 out of 12 worsened / 11 of 12 unchanged
• Intermediate-term(WoW): Negative / 2 of 12 improved / 6 out of 12 worsened / 4 of 12 unchanged
• Long-term(WoW): Negative / 2 of 12 improved / 2 out of 12 worsened / 8 of 12 unchanged

1. U.S. Financial CDS – Movement in swaps was mild last week with the median change at -1 bps. Swaps tightened for 15 out of 27 domestic financial institutions.
Tightened the most WoW: TRV, ALL, MMC
Widened the most WoW: GNW, RDN, MBI
Tightened the most WoW: ALL, CB, ACE
Widened the most MoM: GNW, LNC, C

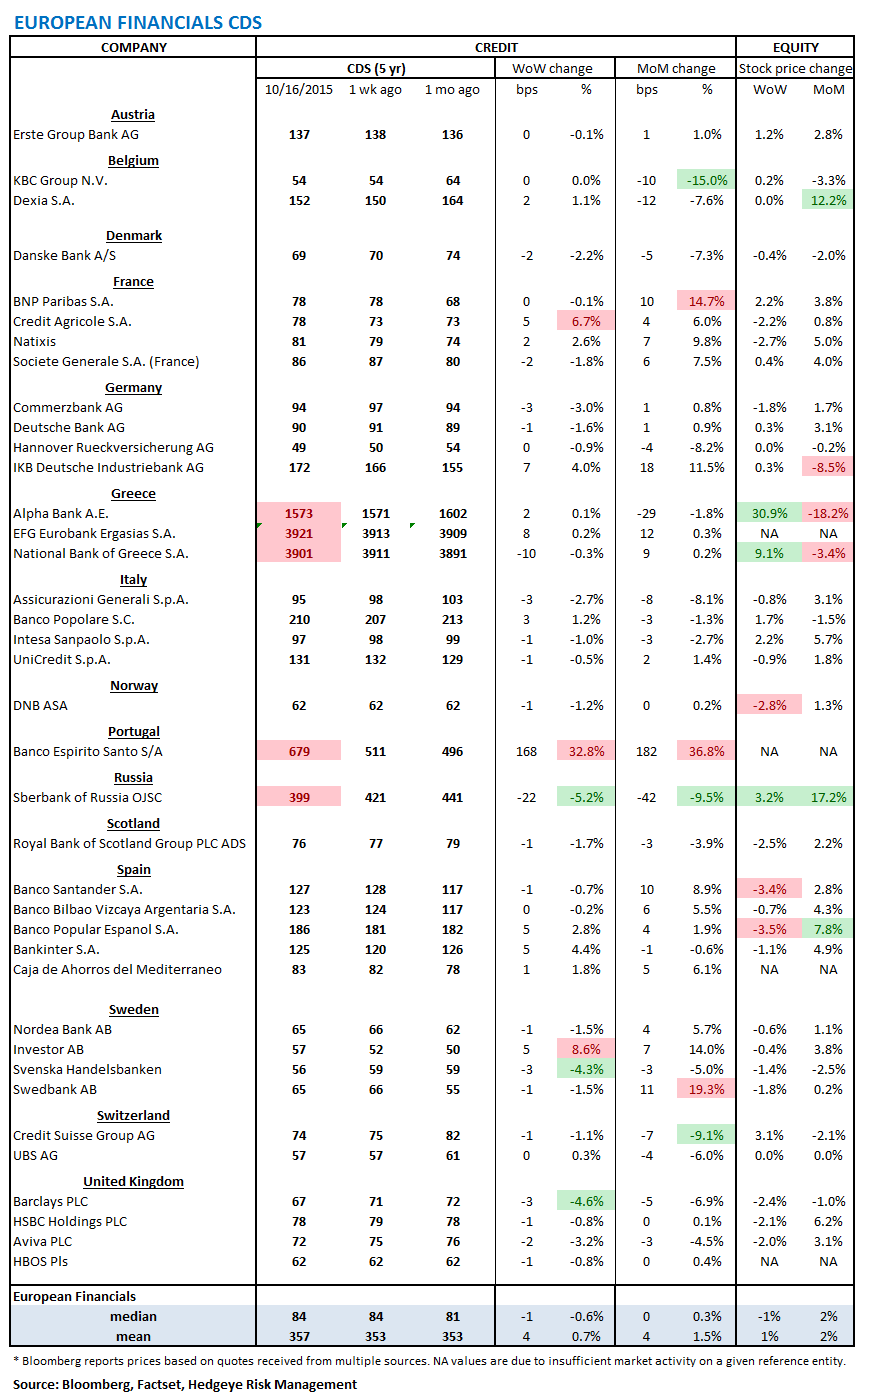
2. European Financial CDS – Swaps mostly tightened in Europe last week although change was mild with a median -1 bps change. CDS for Portuguese Banco Espirito Santo, however, widened by +168 bps to 679, as the country's political negotiations between leftist parties and the ruling center-right coalition remain deadlocked. The widening is interesting because it conflicts with the movement on sovereign Portuguese CDS. The key takeaway for Portugal is that the situation translates to volatility.
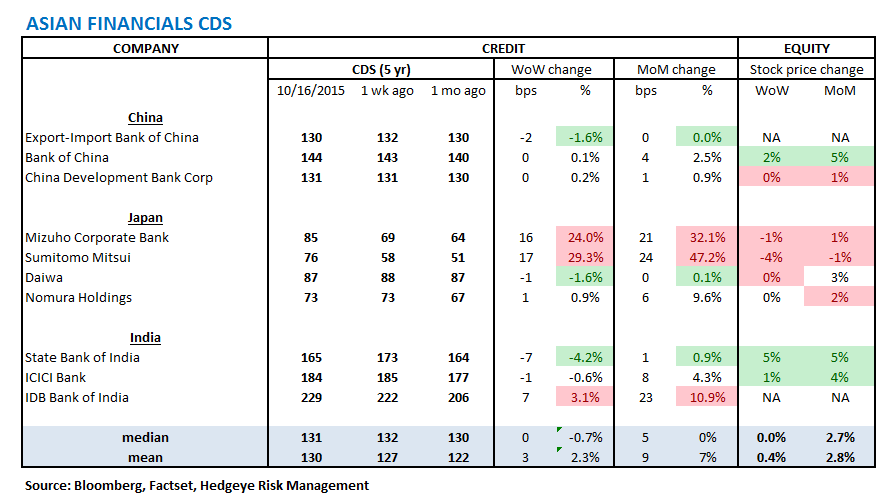
3. Asian Financial CDS – The median change was zero in Asian financials CDS last week. However, Mizuho & Sumitomo financial swaps widened by +16-17 bps.
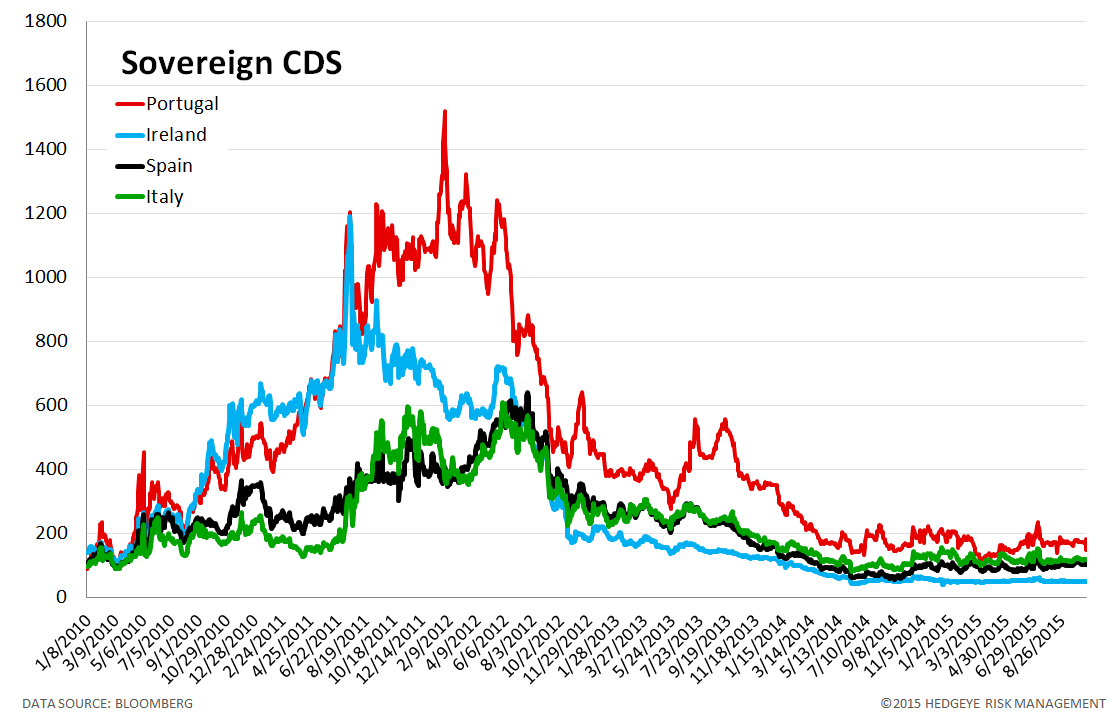
4. Sovereign CDS – Sovereign swaps were mixed last week with mostly minor movement. However, Portuguese sovereign swaps tightened significantly, by -25 bps to 146, as the market interpreted the political situation in the country as a net positive; last week, leftist parties in Portugal signaled their willingness to work with the ruling center-right coalition on the formation of a government, although negotiations remain deadlocked.


5. Emerging Market Sovereign CDS – Emerging market swaps mostly tightened last week. Russian swaps tightened the most, by -31 bps to 289. Brazilian sovereign swaps, however, widened by +30 bps to 441 as Fitch downgraded the country's sovereign credit rating to one notch above junk.


6. High Yield (YTM) Monitor – High Yield rates rose 3 bps last week, ending the week at 7.54% versus 7.51% the prior week.

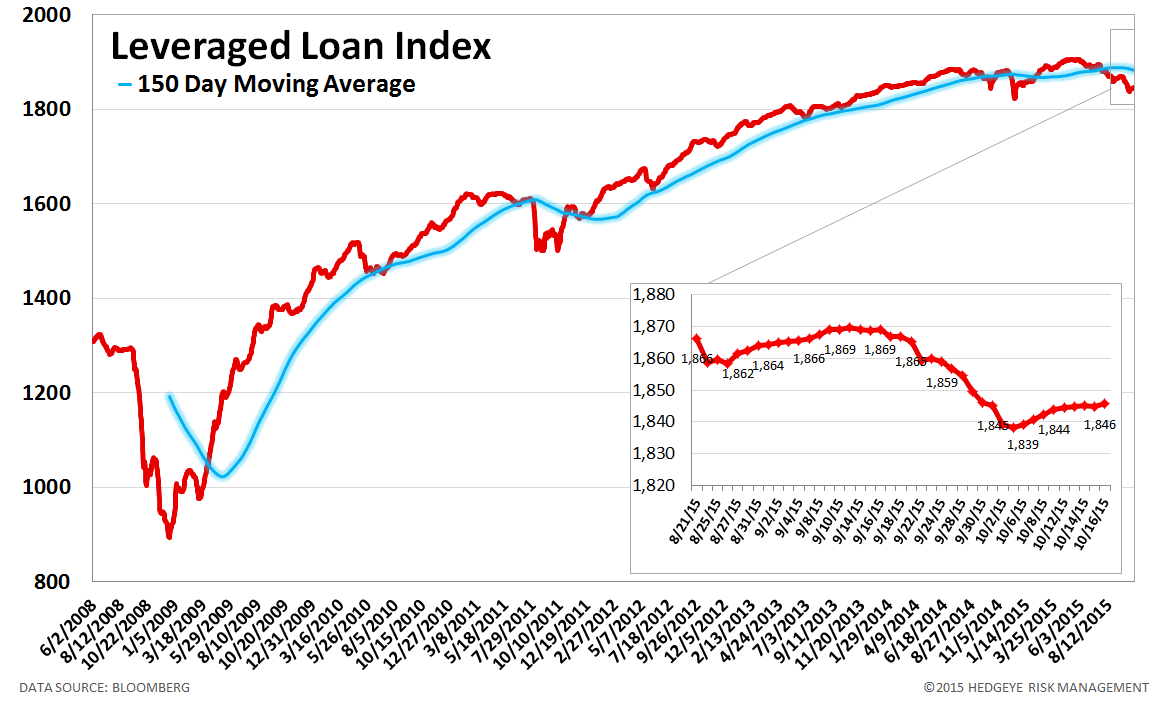
7. Leveraged Loan Index Monitor – The Leveraged Loan Index rose 2.0 points last week, ending at 1846.
8. TED Spread Monitor – The TED spread was unchanged last week at 31 bps.

9. CRB Commodity Price Index – The CRB index fell -0.1%, ending the week at 199 versus 200 the prior week. As compared with the prior month, commodity prices have increased 2.7%. We generally regard changes in commodity prices on the margin as having meaningful consumption implications.

10. Euribor-OIS Spread – The Euribor-OIS spread (the difference between the euro interbank lending rate and overnight indexed swaps) measures bank counterparty risk in the Eurozone. The OIS is analogous to the effective Fed Funds rate in the United States. Banks lending at the OIS do not swap principal, so counterparty risk in the OIS is minimal. By contrast, the Euribor rate is the rate offered for unsecured interbank lending. Thus, the spread between the two isolates counterparty risk. The Euribor-OIS spread was unchanged at 10 bps.

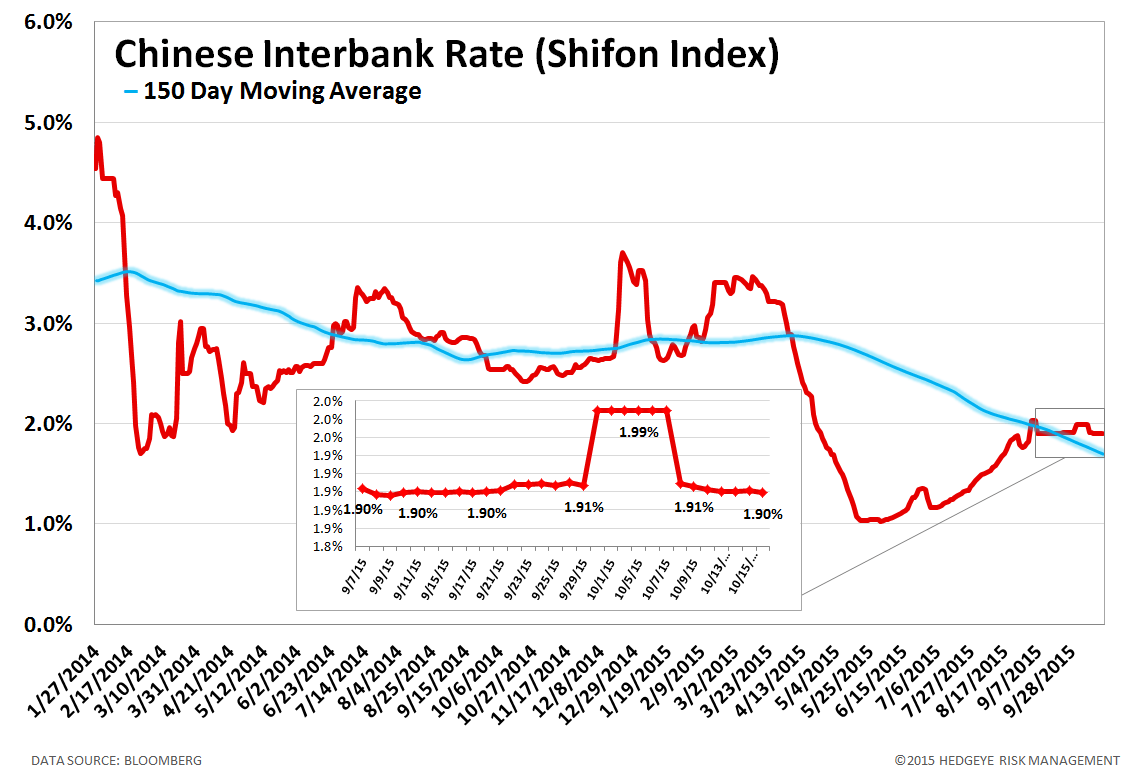
11. Chinese Interbank Rate (Shifon Index) – The Shifon Index fell 1 basis point last week, ending the week at 1.90% versus last week’s print of 1.91%. The Shifon Index measures banks’ overnight lending rates to one another, a gauge of systemic stress in the Chinese banking system.
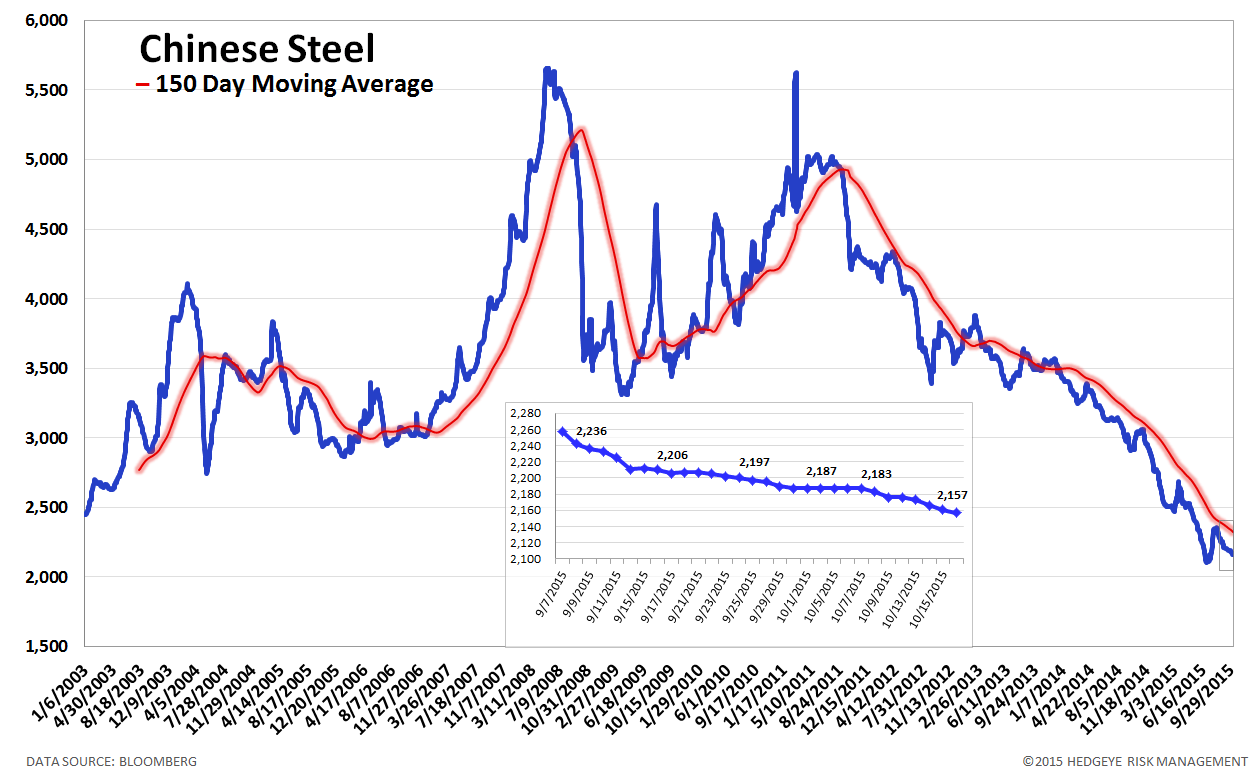
12. Chinese Steel – Steel prices in China fell 0.9% last week, or 19 yuan/ton, to 2157 yuan/ton. We use Chinese steel rebar prices to gauge Chinese construction activity and, by extension, the health of the Chinese economy.
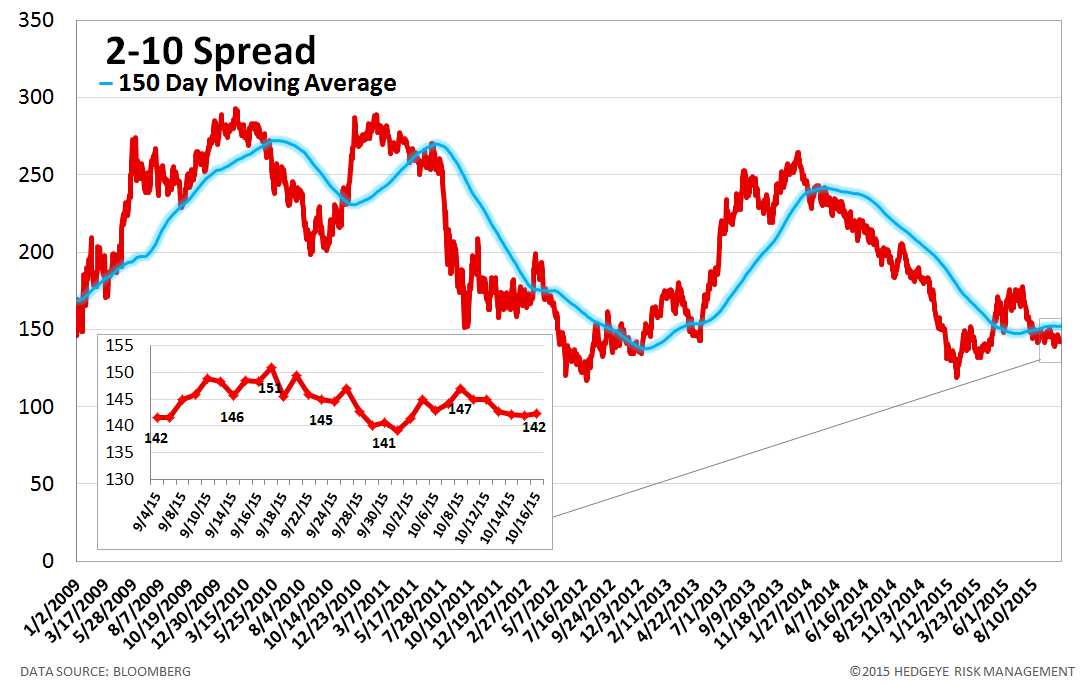
13. 2-10 Spread – Last week the 2-10 spread tightened to 142 bps, -3 bps tighter than a week ago. We track the 2-10 spread as an indicator of bank margin pressure.
14. XLF Macro Quantitative Setup – Our Macro team’s quantitative setup in the XLF shows 0.7% upside to TRADE resistance and 3.4% downside to TRADE support.

Joshua Steiner, CFA
Jonathan Casteleyn, CFA, CMT
