


Key Takeaway:
Last week, what had been predominantly an international risk focus became a global one with the slowdown in China converging with an especially soft U.S. jobs report for September. We've been flagging in our weekly initial jobless claims note that the US economy is late cycle. The September NFP report obviously raises the stakes.
Beyond the weak U.S. jobs report, the latest Chinese PMI reading showed the fastest deterioration since March 2009 and Japanese industrial production fell short of expectations last week. In response, CDS spreads widened globally and high yield credit deteriorated further with the YTM rising by 51 bps to 8.16% - the highest level since 2012 - while the 10-year Treasury yield came in sharply. #Risk-Off
Risk indicators in our heatmap below are decidedly negative on the short and intermediate term. Long-term indicators remain mixed.
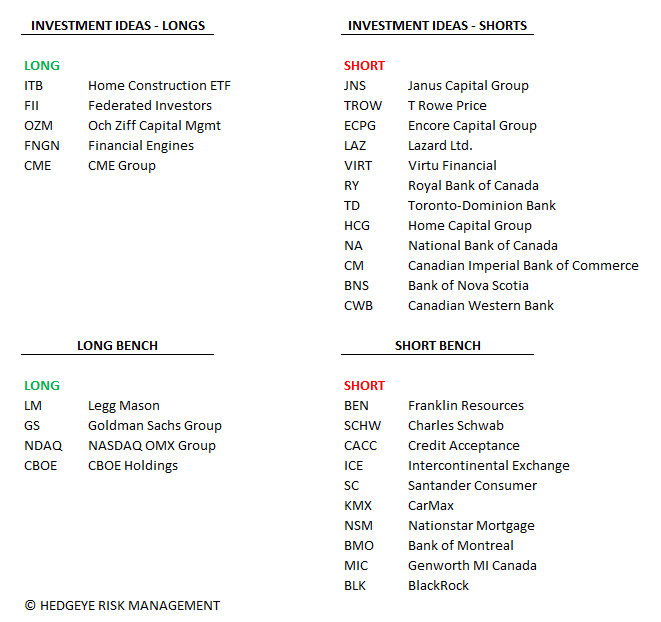
Current Ideas:
Financial Risk Monitor Summary
• Short-term(WoW): Negative / 1 of 12 improved / 4 out of 12 worsened / 7 of 12 unchanged
• Intermediate-term(WoW): Negative / 1 of 12 improved / 8 out of 12 worsened / 3 of 12 unchanged
• Long-term(WoW): Negative / 2 of 12 improved / 2 out of 12 worsened / 8 of 12 unchanged

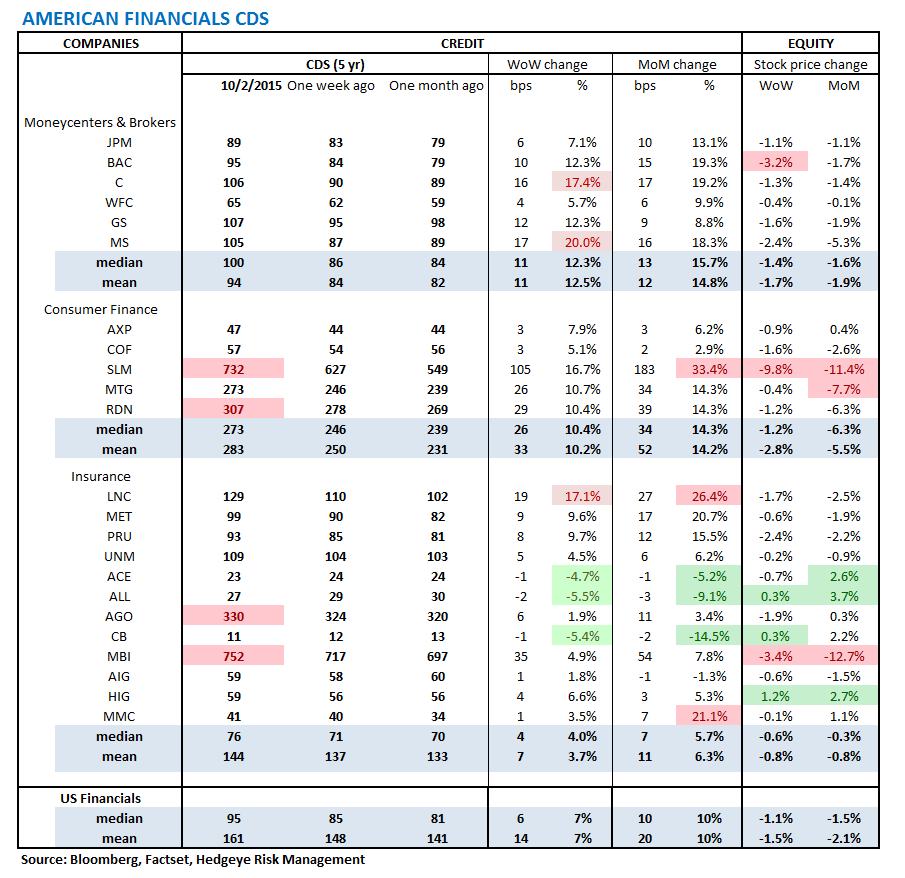
1. U.S. Financial CDS – Swaps widened for 20 out of 27 domestic financial institutions as the jobs report came in at a disappointing 142k jobs added in September. Meanwhile, the challenges continue to mount for Sallie Mae (SLM) as the CDS blew out by a further +105 bps to 732 bps, coinciding with the CFPB announcing it will explore new regulations for student loan servicers.
Tightened the most WoW: ALL, CB, ACE
Widened the most WoW: MS, C, LNC
Tightened the most WoW: CB, ALL, ACE
Widened the most MoM: SLM, LNC, MMC
2. European Financial CDS – Swaps mostly widened in Europe last week with the average move at 5 bps.

3. Asian Financial CDS – Asian CDS widened across the board last week. Fanning the flames was a Chinese PMI reading showing the fastest deterioration since March 2009 and Japanese industrial production falling short of expectations.

4. Sovereign CDS – Sovereign swaps were mixed over last week. Portuguese sovereign swaps tightened the most, by -5 bps to 174, while Japanese swaps widened the most, by +5 bps to 46.


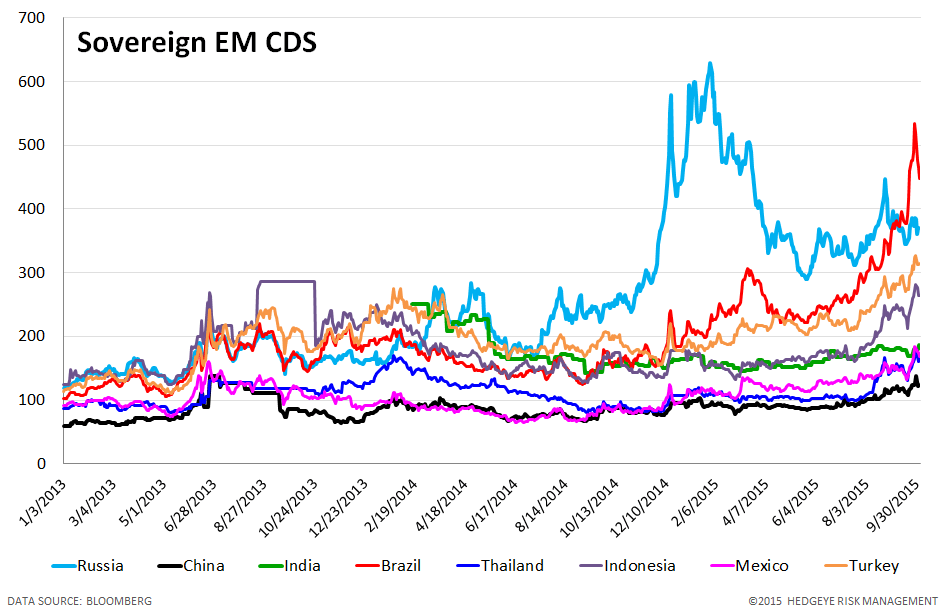
5. Emerging Market Sovereign CDS – Brazilian swaps tightened an impressive -41 bps W/W to 447 bps, but outside of Brazil most of the EM space saw swaps widen.

6. High Yield (YTM) Monitor – High Yield rates rose 51 bps last week, ending the week at 8.16% versus 7.65% the prior week.

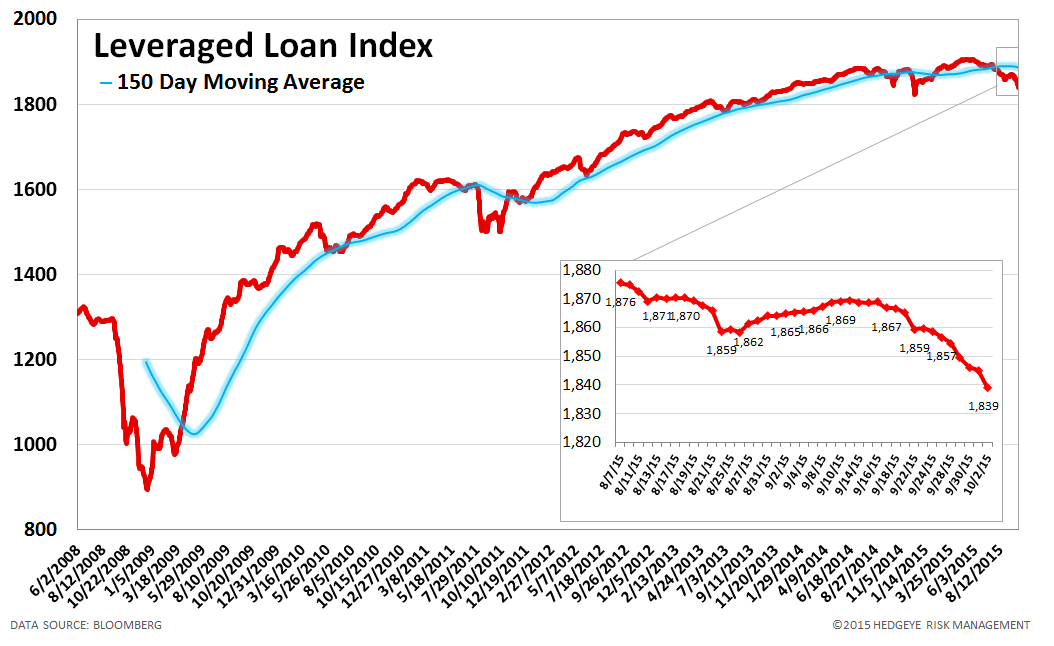
7. Leveraged Loan Index Monitor – The Leveraged Loan Index fell 18.0 points last week, ending at 1839.
8. TED Spread Monitor – The TED spread fell 2 basis points last week, ending the week at 33 bps this week versus last week’s print of 34 bps.

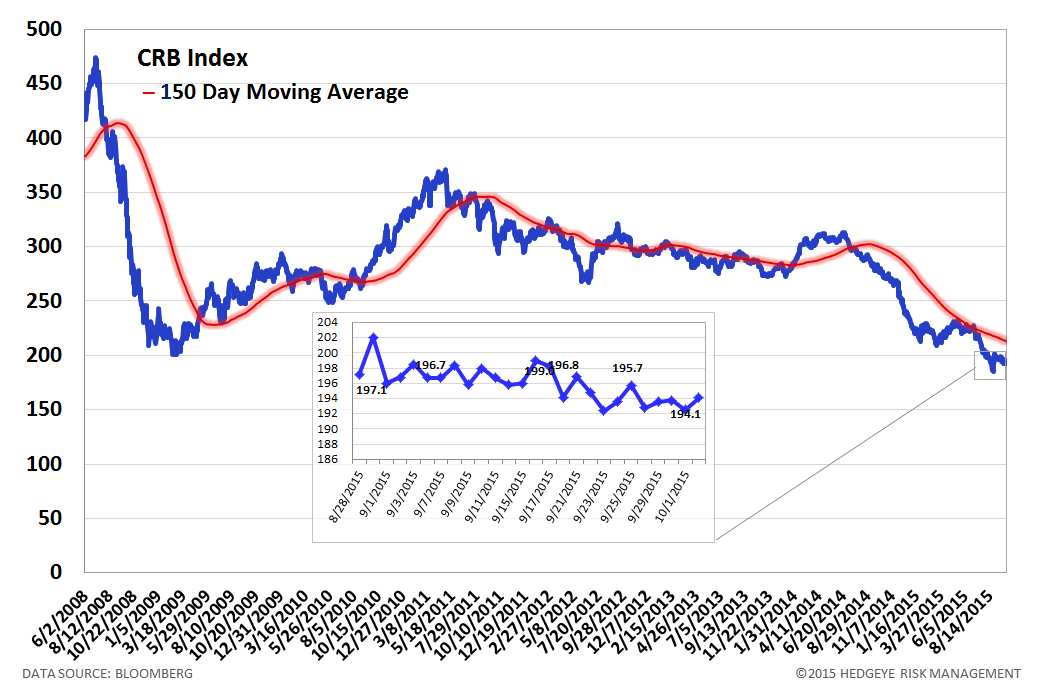
9. CRB Commodity Price Index – The CRB index rose 0.9%, ending the week at 194 versus 192 the prior week. As compared with the prior month, commodity prices have decreased -1.3%. We generally regard changes in commodity prices on the margin as having meaningful consumption implications.
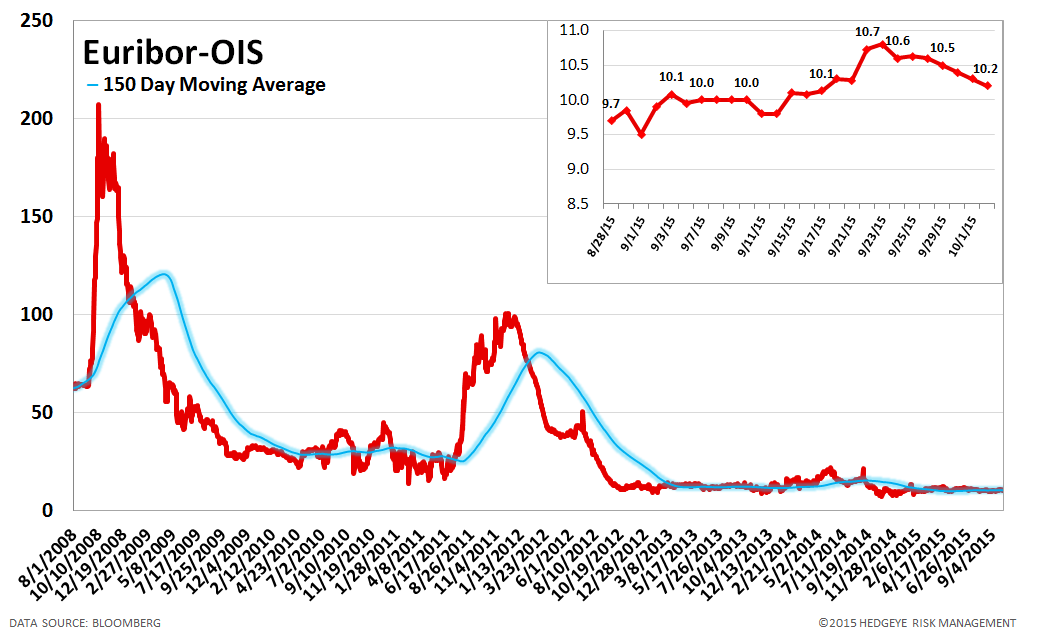
10. Euribor-OIS Spread – The Euribor-OIS spread (the difference between the euro interbank lending rate and overnight indexed swaps) measures bank counterparty risk in the Eurozone. The OIS is analogous to the effective Fed Funds rate in the United States. Banks lending at the OIS do not swap principal, so counterparty risk in the OIS is minimal. By contrast, the Euribor rate is the rate offered for unsecured interbank lending. Thus, the spread between the two isolates counterparty risk. The Euribor-OIS spread was unchanged at 10 bps.
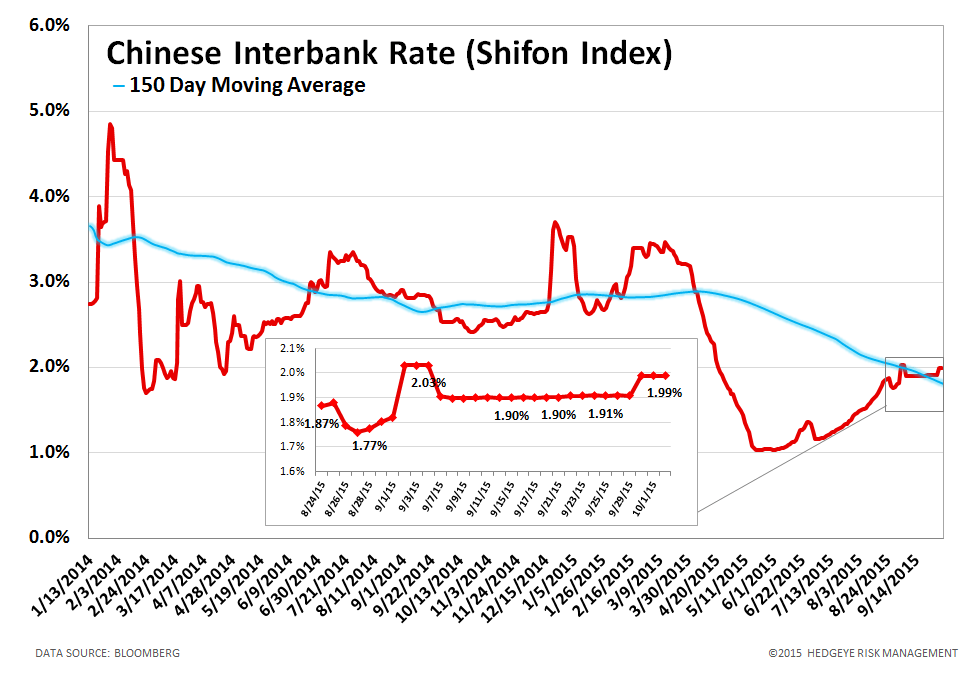
11. Chinese Interbank Rate (Shifon Index) – The Shifon Index rose 8 basis points last week, ending the week at 1.99% versus last week’s print of 1.91%. The Shifon Index measures banks’ overnight lending rates to one another, a gauge of systemic stress in the Chinese banking system.
12. Chinese Steel – Steel prices in China fell 0.5% last week, or 10 yuan/ton, to 2187 yuan/ton. We use Chinese steel rebar prices to gauge Chinese construction activity and, by extension, the health of the Chinese economy.

13. 2-10 Spread – Last week the 2-10 spread tightened to 141 bps, -6 bps tighter than a week ago. We track the 2-10 spread as an indicator of bank margin pressure.

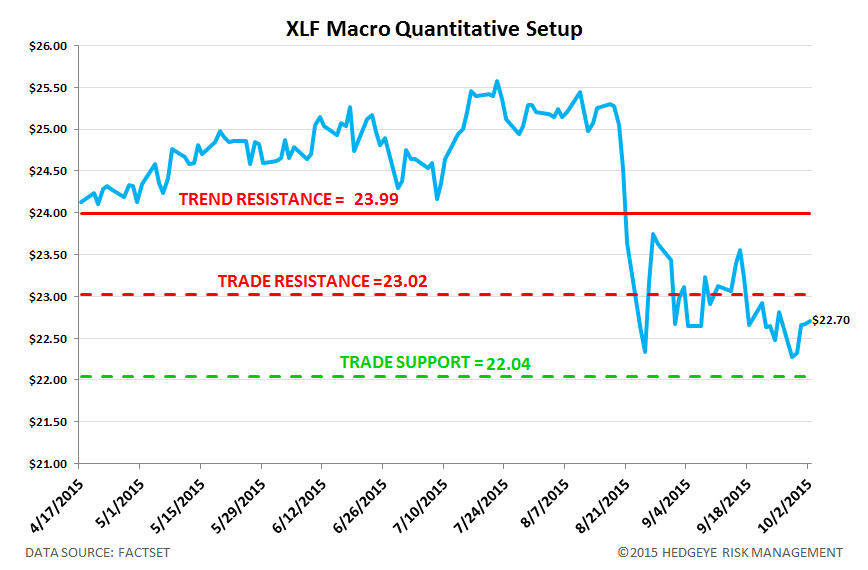
14. XLF Macro Quantitative Setup – Our Macro team’s quantitative setup in the XLF shows 1.4% upside to TRADE resistance and 2.9% downside to TRADE support.
Joshua Steiner, CFA
Jonathan Casteleyn, CFA, CMT
