

Our Hedgeye Housing Compendium table (below) aspires to present the state of the housing market in a visually-friendly format that takes about 30 seconds to consume.

Today’s Focus: 2Q15 Homeownership and Vacancy Survey & May Case-Shiller HPI
Homeownership and Vacancy Survey: 2Q15
The Census Bureau released the Homeownership and Vacancy Survey (HVS) for 2Q15 this morning.
First, the caveats. The HVS survey is timely and widely cited, but it’s volatile and doesn’t always comport cleanly with the more comprehensive annual Census/CPS housing surveys or a common sense reading of reality.
We take the data with a grain of salt and, while we view the magnitude of change as a distorted reflection of the underlying reality, we view directional changes in the data as a largely accurate depiction of the underlying trend.
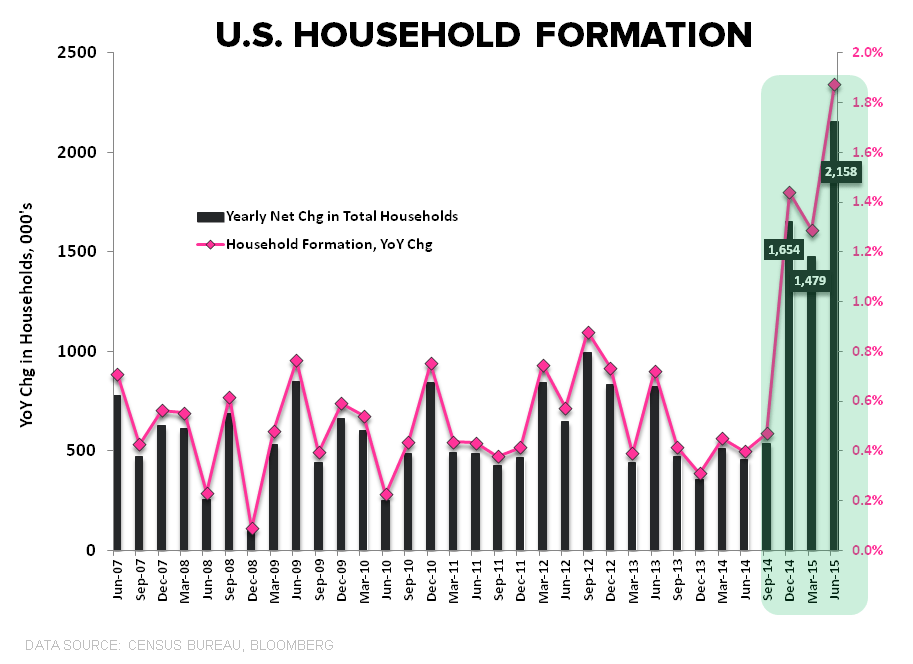
Household Formation: Household formation in 4Q of last year saw a big step function move higher with the yearly net change in households jumping to 1.6 MM – the largest increase in a decade. Those gains saw follow through strength in the 1st quarter of 2015 with household formation up approximately 1.5 MM year-over-year. The update for 2Q shows net HH formation up +2.16 MM YoY (+1.05 MM QoQ) – with the gains, again, singularly a result of rising rental demand as the rental vacancy rate declined to a new multi-decade low of 6.8%, pushing excess for-rent inventory further into deficit.
Homeownership: The National Homeownership rate dropped to 63.4% in 2Q from 63.7% prior, marking a new 48-year low. Homeownership rates declined across age groups with the notable exception of 18-34 year-olds where the rate improved to 34.8% from 34.6% prior.
In light of the marked improvement in household formation in recent quarters it's worth re-remembering the fundamental short-comings of the Homeownership Rate.
Households can either be Renters or Owners and the Homeownership Rate represents Owners/(Owners + Renters). Thus, if the number of households is increasing but the number or renters is rising faster than the number of owners (as is the case currently), then the Homeownership Rate will decline.
It’s hard to characterize strong household formation growth – regardless of type - as a fundamentally negative development for the housing market, particularly with the propensity for strong rental market demand and rising rental prices to serve as a conduit to rising single-family purchase demand.
Bottom Line: The magnitude of increase in HH formation reported by the Census Bureau is likely overstated but the trend towards improving formation rates is probably correct. The maturation of the employment recovery broadly and accelerating employment growth across the 25-34 YOA group specifically (where positive employment growth is just now reaching the 2.5yr mark) supports the trend in the HH formation data and the reported rise in homeownership rates among young buyers. We expect headship rates, which = households/population and represents a more comprehensive measure of participation, to improve alongside labor/income fundamentals. We’ll get the official data for 2014 from the Census bureau in September.
Case-Shiller HPI (May)
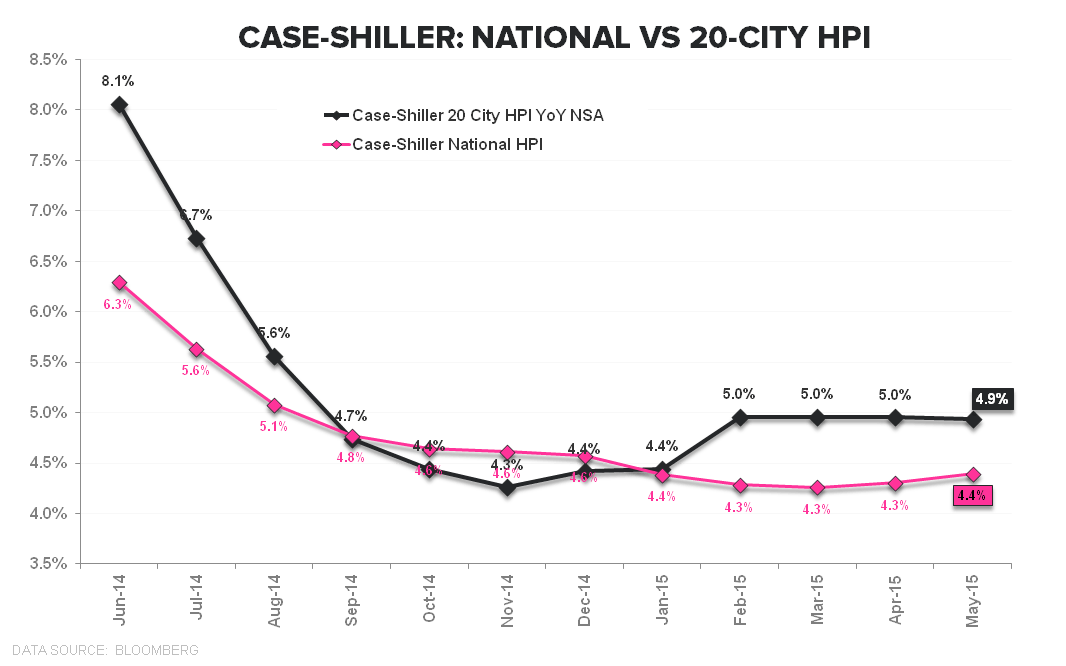
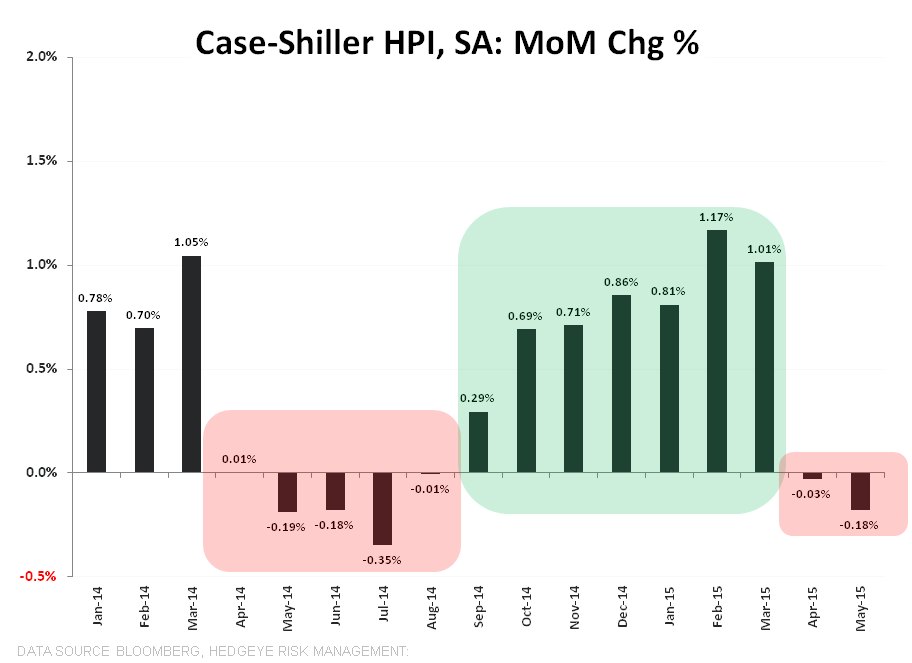
The Case-Shiller 20-City HPI for May released this morning – which represents average price data over the March-May period – showed home prices declining -0.2% MoM and decelerating to +4.9% year-over-year (vs +5.0% prior).
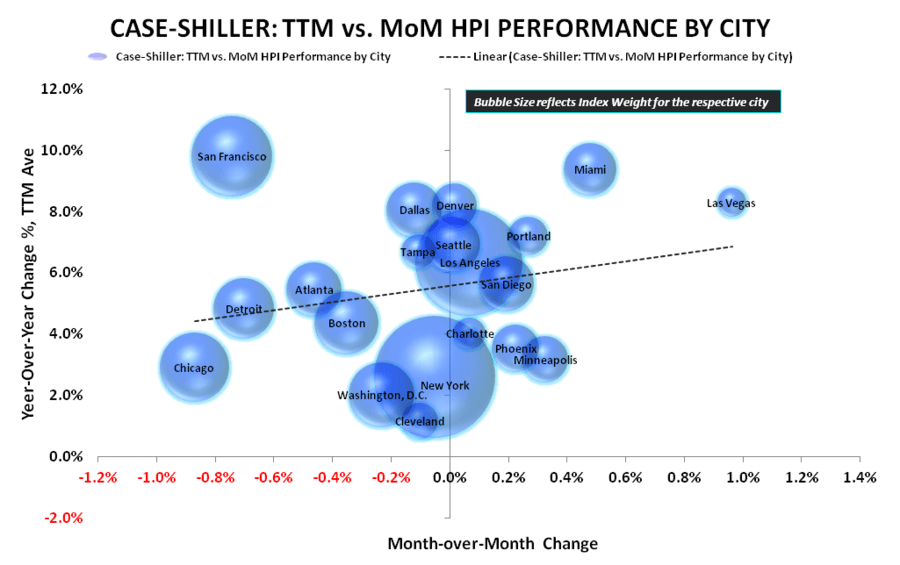
On an NSA basis, all 20 cities reported sequential increases in May while on an SA basis, 10-cities reported declines. Notably, Index heavyweights New York, Boston, Chicago, San Francisco and D.C, which collectively carry a 45% weight in the 20-city index, all showed sequential declines. Moreover, Los Angeles, which alone carries a 15% weighting managed just a 0.1% gain on the month. Performance by City is illustrated in the scatterplots below.
In contrast to the 20-city series, the National HPI which covers all U.S. Census divisions showed a modest +10bps acceleration sequentially to +4.4% YoY.
The deceleration in the 20-city series also stands in contrast to both the CoreLogic HPI and FHFA HPI series for May which showed a marked acceleration in price growth. As it stands, we remain inclined to side with the CoreLogic data as it's more leading and accords with the rising demand, tightening supply dynamic prevailing currently.
Price growth can’t sustainably accelerate at a premium to income growth in a flat rate environment and select markets like San Francisco are certainly over-stretched from an affordability perspective but, in the aggregate, affordability remains good, sitting perched right between the bottom and second-from-bottom quartile of the last ~30 years.
On the HPI front, the more important release will be next week’s CoreLogic data for June along with the short-term projection for July.


About Case Shiller:
The S&P/Case-Shiller Home Price Index measures the changes in value of residential real estate by tracking single-family home re-sales in 20 metropolitan areas across the US. The index uses purchase price information obtained from county assessor and recorder offices. The Case-Shiller indexes are value-weighted, meaning price trends for more expensive homes have greater influence on estimated price changes than other homes. It is vital to note that the index’s printed number is a 3-month rolling average released on a two month delay.
Frequency and Release Date:
The S&P/Case-Shiller HPI is released on the last Tuesday of every month. The index is on a two month lag and therefore does not reflect the most recent month’s home prices.
Joshua Steiner, CFA
Christian B. Drake
