

This note was originally published June 04, 2015. Click here for more info on how you can subscribe to our investing products.
Investment Company Institute Mutual Fund Data and ETF Money Flow:
Investors continue to pull funds from active domestic equity mutual fund mandates, withdrawing -$2.9 billion in the 5-day period ending May 27th according to the latest ICI survey. This marks the 13th consecutive week of withdrawals from the category. Another trend that has appeared recently is withdrawals from tax-free or municipal bond funds. Last week, investors withdrew -$170 million from munis, marking the 4th consecutive week of withdrawals. Fund flows for the entire bond category in general were weak last week with investors only contributing +$98 million to total bond mutual funds and ETFs. Conversely, equities via international mutual funds and passive ETFs won support with a +$2.1 billion contribution.
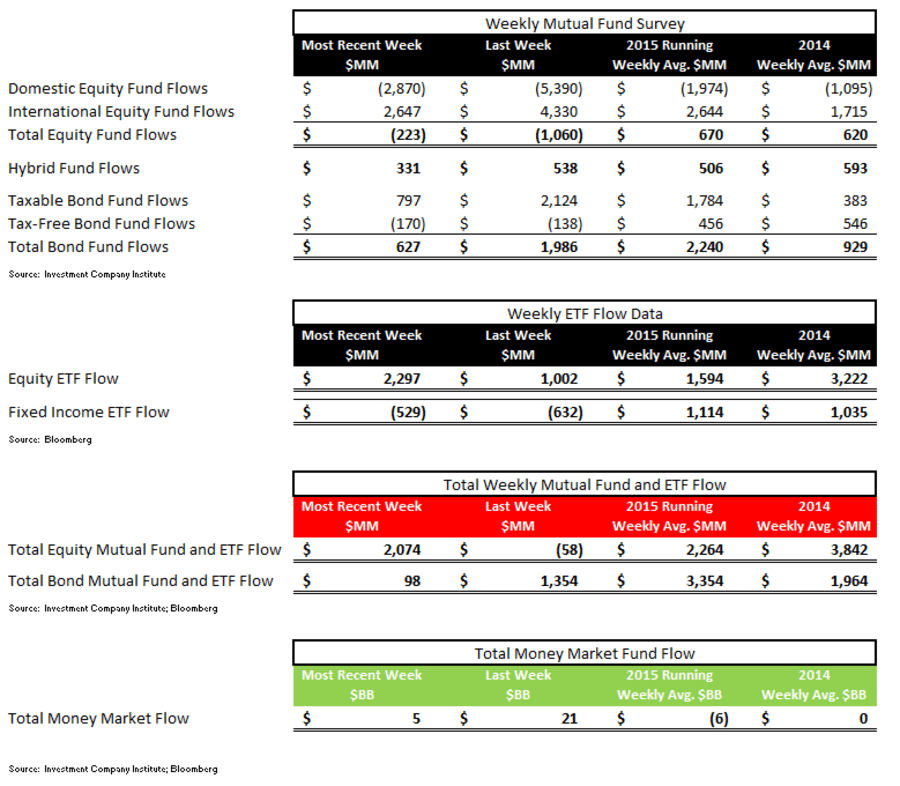
In the most recent 5-day period ending May 27th, total equity mutual funds put up net outflows of -$223 million, trailing the year-to-date weekly average inflow of +$670 million and the 2014 average inflow of +$620 million. The outflow was composed of international stock fund contributions of +$2.6 billion and domestic stock fund withdrawals of -$2.9 billion. International equity funds have had positive flows in 48 of the last 52 weeks while domestic equity funds have had only 10 weeks of positive flows over the same time period.
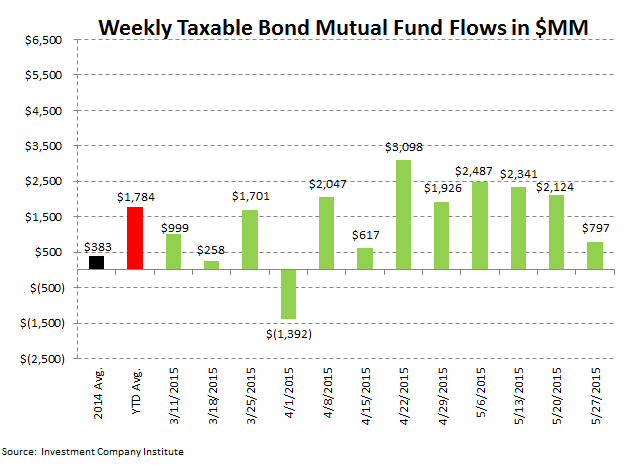
Fixed income mutual funds put up net inflows of +$627 million, trailing the year-to-date weekly average inflow of +$2.2 billion and the 2014 average inflow of +$929 million. The inflow was composed of tax-free or municipal bond funds withdrawals of -$170 million and taxable bond funds contributions of +$797 million.
Equity ETFs had net subscriptions of +$2.3 billion, outpacing the year-to-date weekly average inflow of +$1.6 billion but trailing the 2014 average inflow of +$3.2 billion. Fixed income ETFs had net outflows of -$529 million, trailing the year-to-date weekly average inflow of +$1.1 billion and the 2014 average inflow of +$1.0 billion.
Mutual fund flow data is collected weekly from the Investment Company Institute (ICI) and represents a survey of 95% of the investment management industry's mutual fund assets. Mutual fund data largely reflects the actions of retail investors. Exchange traded fund (ETF) information is extracted from Bloomberg and is matched to the same weekly reporting schedule as the ICI mutual fund data. According to industry leader Blackrock (BLK), U.S. ETF participation is 60% institutional investors and 40% retail investors.
Most Recent 12 Week Flow in Millions by Mutual Fund Product: Chart data is the most recent 12 weeks from the ICI mutual fund survey and includes the weekly average for 2014 and the weekly year-to-date average for 2015:


Most Recent 12 Week Flow Within Equity and Fixed Income Exchange Traded Funds: Chart data is the most recent 12 weeks from Bloomberg's ETF database (matched to the Wednesday to Wednesday reporting format of the ICI), the weekly average for 2014, and the weekly year-to-date average for 2015. In the third table are the results of the weekly flows into and out of the major market and sector SPDRs:


Sector and Asset Class Weekly ETF and Year-to-Date Results: In sector SPDR callouts, investors resumed withdrawals from the long treasury TLT ETF, redeeming -$328 million or -7% last week.

Net Results:
The net of total equity mutual fund and ETF flows against total bond mutual fund and ETF flows totaled a positive +$2.0 billion spread for the week (+$2.1 billion of total equity inflow net of the +$98 million inflow to fixed income; positive numbers imply greater money flow to stocks; negative numbers imply greater money flow to bonds). The 52-week moving average is +$1.5 billion (more positive money flow to equities) with a 52-week high of +$27.9 billion (more positive money flow to equities) and a 52-week low of -$13.1 billion (negative numbers imply more positive money flow to bonds for the week.)

Exposures: The weekly data herein is important for the public asset managers with trends in mutual funds and ETFs impacting the companies with the following estimated revenue impact:

Jonathan Casteleyn, CFA, CMT
203-562-6500
Joshua Steiner, CFA
203-562-6500
