

Our Hedgeye Housing Compendium table (below) aspires to present the state of the housing market in a visually-friendly format that takes about 30 seconds to consume.

Today's Focus: November New Home Sales & October FHFA HPI
FHFA HPI
FHFA HPI accelerated to +4.4% in October from +4.2% in September. All three primary price series are now telling the same (2nd derivative) stabilization story.


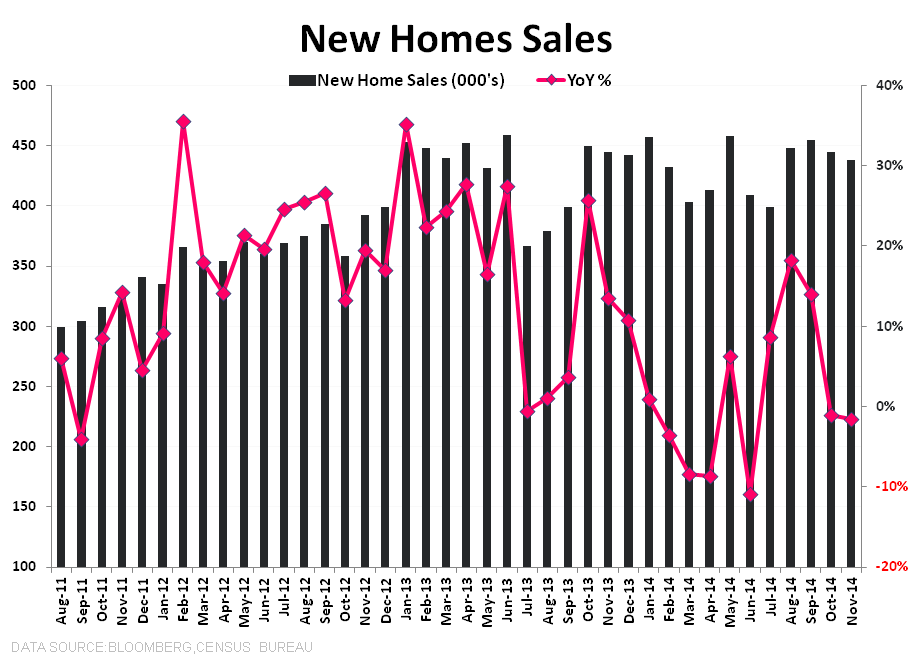
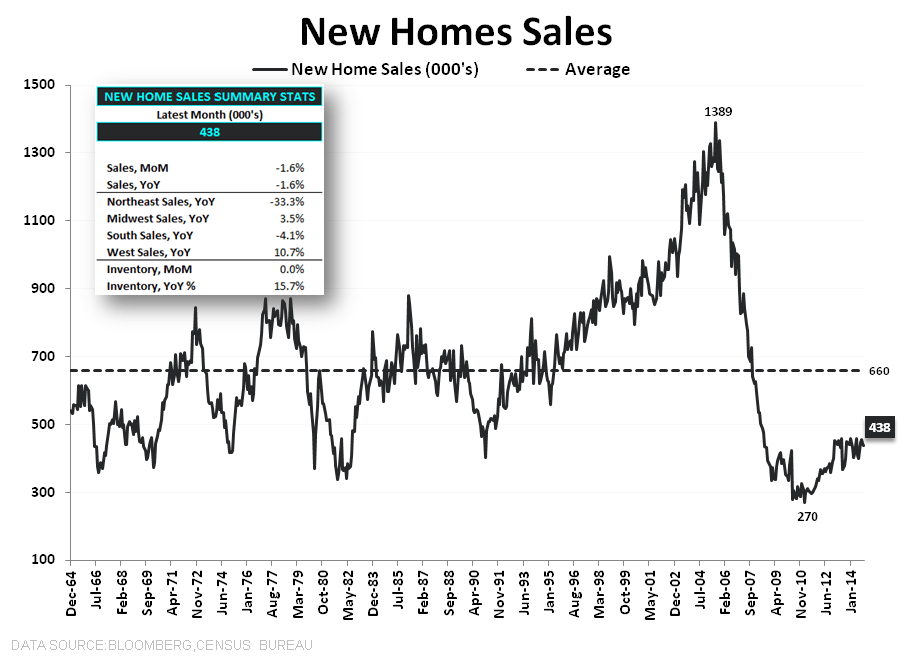
November New Home Sales
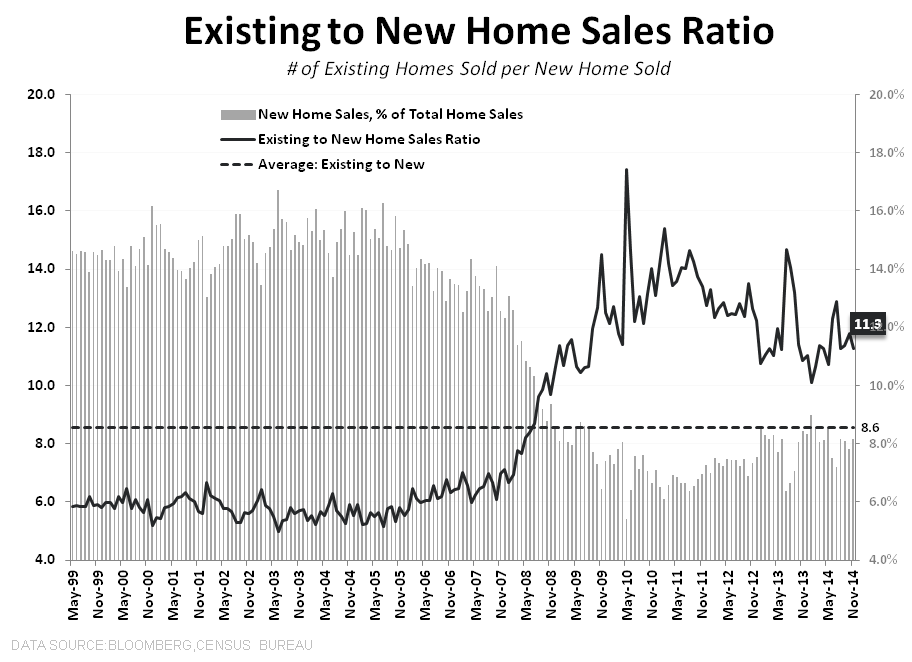
- New Home Sales were down -1.6% on both a MoM & YoY basis. Meanwhile, New Home Sales are up just +0.7% YoY on average YTD vs. the Jan-Nov period last year and at +438K in November they sit just above the TTM average of +434K. New Home Inventory was flat at +214K sequentially, and is up +15.7% YoY. Existing Home Sales continues to dominate with the EHS to NHS ratio still at 11.3x vs the long-term average of 8.6x. Note that in contrast to most demand measures (purchase apps, EHS, etc) the comps for NHS are actually (somewhat) hard over the Oct-Jan period with NHS averaging +449K and 13% YoY Growth.


About New Home Sales:
Each month the Census Department releases the New Home Sales report, which measures the number of newly constructed homes that have been sold in the month. The difference between the New Home Sales report and the Starts and Permits report is that New Home Sales only includes single family spec homes built and sold by builders, and does not include condos, apartments, or owner-built units. This is why New Home Sales typically run at roughly half the rate of Starts.
Joshua Steiner, CFA
Christian B. Drake
