Our Hedgeye Housing Compendium table (below) aspires to present the state of the housing market in a visually-friendly format that takes about 30 seconds to consume.
*Note - to maintain cross-metric comparability, the purchase applications index shown in the table below represents the monthly average as opposed to the most recent weekly data point.

Today's Focus: August New Home Sales & MBA Mortgage Applications
August New Home Sales
Key Takeaways:
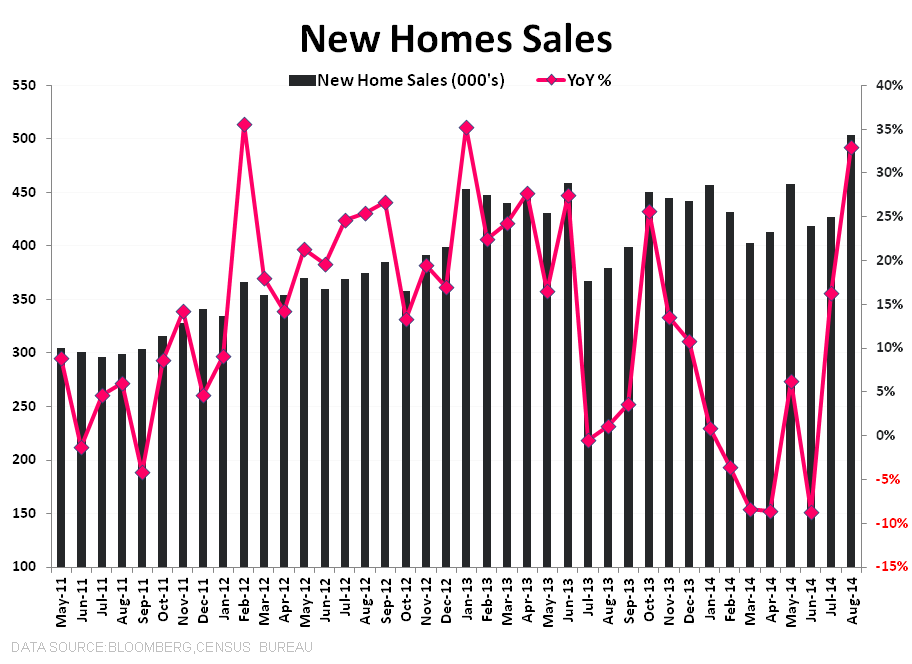
- New Home Sales rose +18% MoM vs upwardly revised July figures to 504K SAAR – the highest level since May of 2008 and the largest MoM increase since January 1992
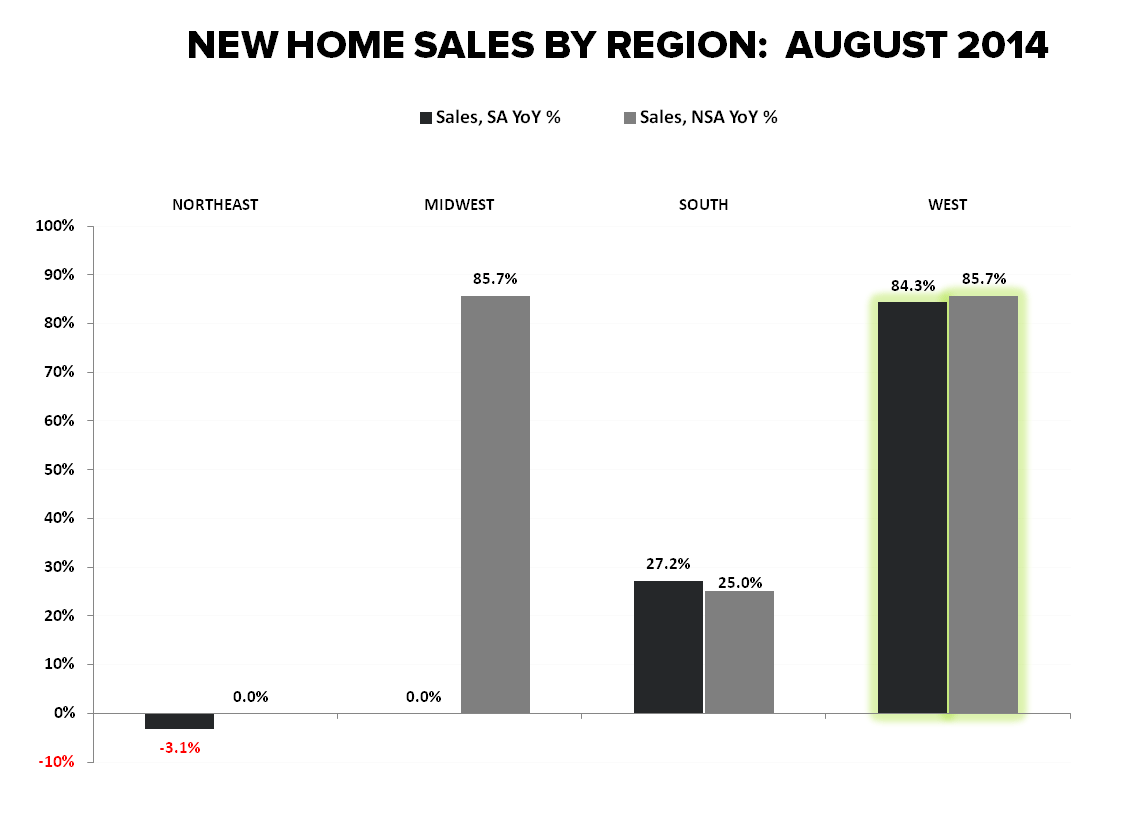
- Wild West: Under the Hood, the strength was driven by the South and West regions where growth in new home sales was +27% and +84%, respectively. New Home Sales were up a moonshot +50% MoM in the West, rising to the highest level since 2007. New home sales were flat in the Midwest and improved sequentially in the Northeast, but remain negative on a YoY basis.
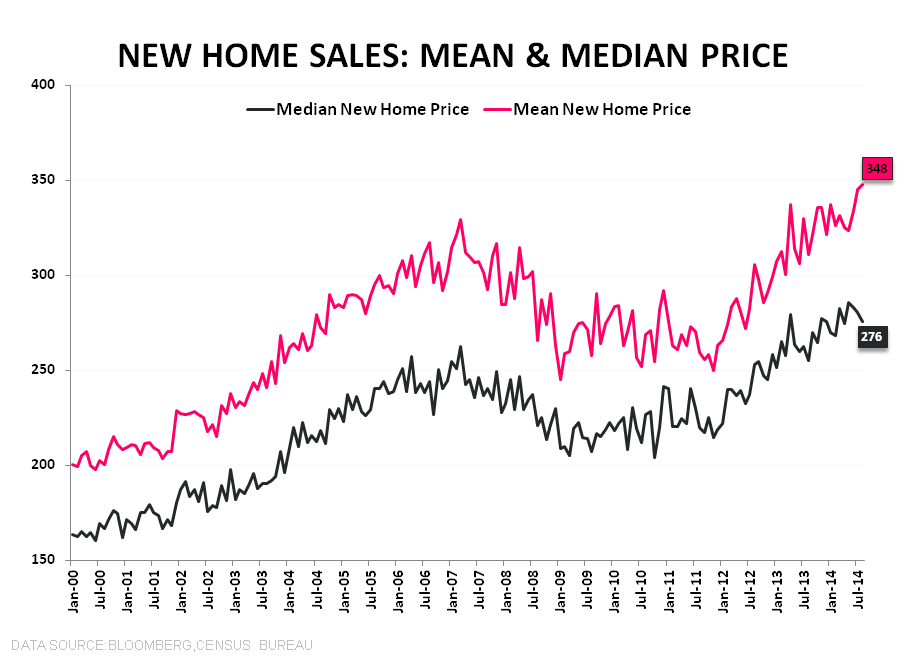
- PRICE: Median New Home Price fell -1.6% sequentially to $276K although they re-accelerated on a YoY basis to +8% from +6.8% in July. Mean New Home prices made another new high, rising +0.8% sequentially to $348K. The more recent divergence between the two series suggests strength in the ultra-high end is pulling on prices.
Taking a quick survey of the current landscape and the prevailing ping-pong match in housing data: New Home Sales hit a 6 year high in August alongside a big miss out of KBH and soft guidance out of TOL. Meanwhile, in perfect in-congruency, builder confidence hit a new high in September as both New Home Starts & EHS declined sequentially, Mortgage Purchase demand continues to plumb multi-decade lows, and the rate of change across the primary HPI measures (Case-shiller, Corelogic, FHFA) have begun to diverge for the first time in quite a while.
The ITB took its cues from KBH earlier this morning, but has been rallying since the release of this NHS report. Bigger picture, at -6.5% for the year, housing remains one of the worst performing asset classes YTD in an otherwise largely-teflon tape.


MBA Mortgage Applications
The Mortgage Bankers Association today released its weekly mortgage applications survey data for the week ended September 19th.
- Mortgage Applications fell -4.1% as Purchase demand fell for the 3rd time in 4 weeks and refi activity retreated -7% as rates continued their northward march.
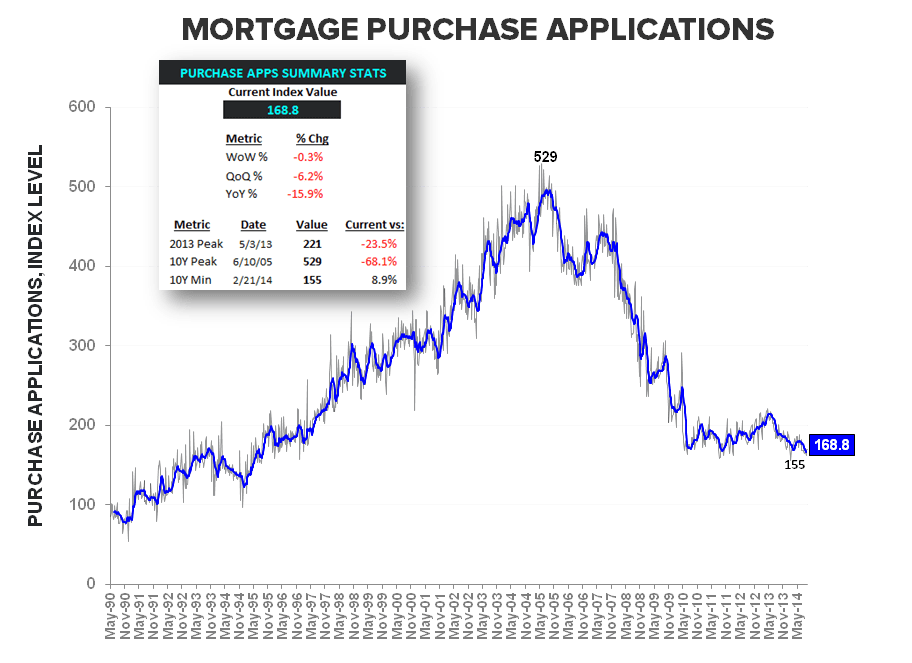
- Purchase Applications: Purchase volume declined a modest -0.3% sequentially, holding below the 170-level for an 11th consecutive week. Purchase Activity is currently tracking -6.2% on a QoQ basis, the lowest level since 2Q95. On a year-over-year basis, purchase applications were down -15.9% in the latest week (vs -10% prior) against the last hard compare of the year. From here, the YoY comps go negative and get progressively easier through the balance of 2H.
- Refinance activity declined -7% WoW as rates on the 30Y FRM contract rose +3bps to 4.39%. Rates are now at their highest levels since early May, having risen +13bps in four weeks since bottoming at 4.25% at the end of August.


About New Home Sales:
Each month the Census Department releases the New Home Sales report, which measures the number of newly constructed homes that have been sold in the month. The difference between the New Home Sales report and the Starts and Permits report is that New Home Sales only includes single family spec homes built and sold by builders, and does not include condos, apartments, or owner-built units. This is why New Home Sales typically run at roughly half the rate of Starts.
About MBA Mortgage Applications:
The Mortgage Bankers’ Association’s mortgage applications index covers more than 75% of mortgage applications originated through retail and consumer direct channels. It does not include loans delivered through wholesale broker and correspondent channels. The MBA mortgage purchase applications index is considered a leading indicator of single-family home sales and construction. Moreover, it is the only housing index that is released on a weekly basis.
Frequency:
The MBA Purchase Apps index is released every Wednesday morning at 7 am EST.
Joshua Steiner, CFA
Christian B. Drake
