Current Best Ideas:

Key Callouts:
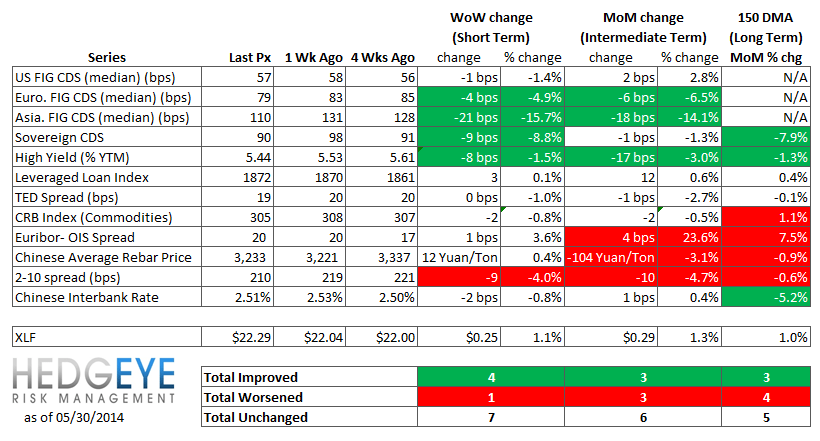
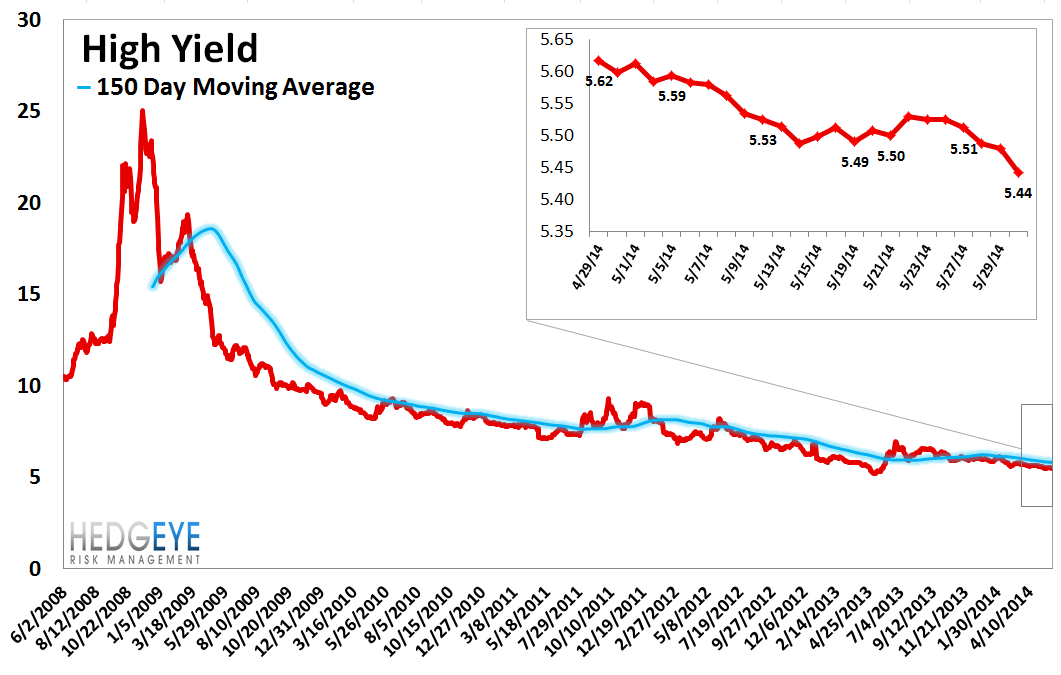
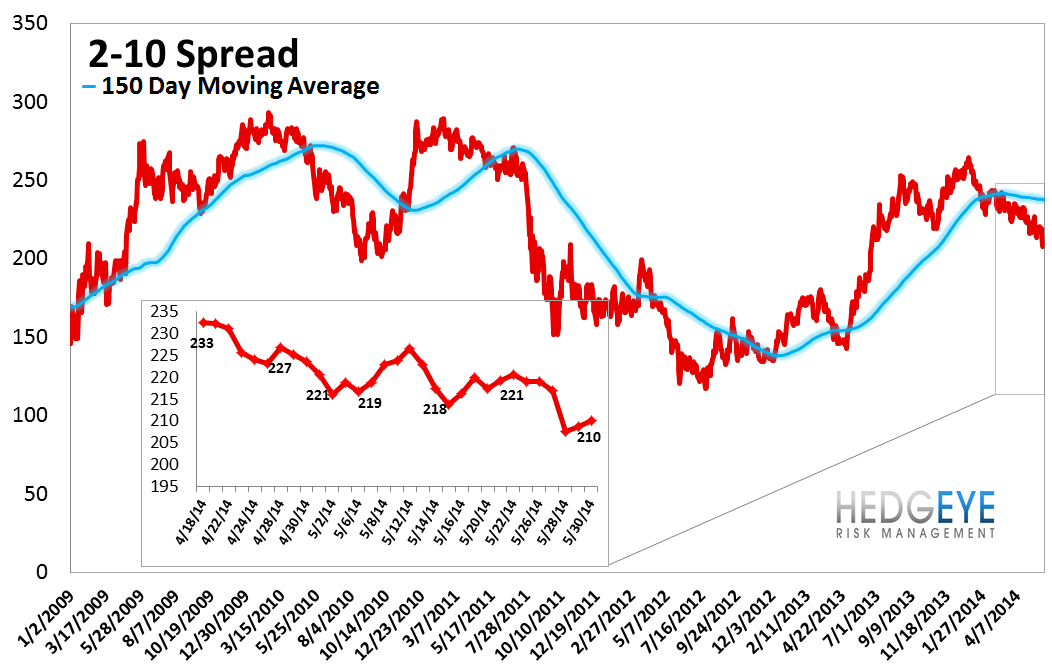
The rise in yield spreads was short-lived as last week we saw the 2-10 spread collapse another 9 bps, bringing the spread down to 210 bps. The pressure on bank stocks is growing as the KRE regional bank ETF is down ~9% vs its early April closing price. Separately, Euribor-OIS continues to widen out, slowly but steadily. Historically, rising Euribor-OIS has coincided with rising stress in the EU banking system so we're keeping one eye on it even though individual EU bank swaps are signaling ongoing improvement. Finally, high yield rates dropped sharply on the week, coming in by 8.3 bps last week and ending the week at 5.53%. This puts high yield on track to re-test the lows (in yields) seen in May of 2013.
Financial Risk Monitor Summary
• Short-term(WoW): Positive / 4 of 12 improved / 1 out of 12 worsened / 7 of 12 unchanged
• Intermediate-term(WoW): Negative / 3 of 12 improved / 3 out of 12 worsened / 6 of 12 unchanged
• Long-term(WoW): Negative / 3 of 12 improved / 4 out of 12 worsened / 5 of 12 unchanged
1. U.S. Financial CDS - Swaps tightened for 25 out of 27 domestic financial institutions. While the moves were small, -2 bps on average, the direction of the move was broad-based. The only outlier this week was Assured Guaranty (AGO), which rose by a modest 5 bps w/w.
Tightened the most WoW: GS, MS, UNM
Widened the most/ tightened the least WoW: AGO, XL, AON
Tightened the most WoW: AXP, MBI, SLM
Widened the most MoM: GNW, WFC, HIG

2. European Financial CDS - Swaps mostly tightened in Europe last week outside of Greece, where swaps widened notably at two of the three banks we track. Overall, 36 European banks were tighter on the week while just 4 were wider.

3. Asian Financial CDS - There was material tightening of Chinese bank swaps last week with an average decline of 21 bps. Meanwhile, the tightening in Indian banks continued again last week, tightening a further 7 bps, on average. Japanese financials were nominally wider on the week.

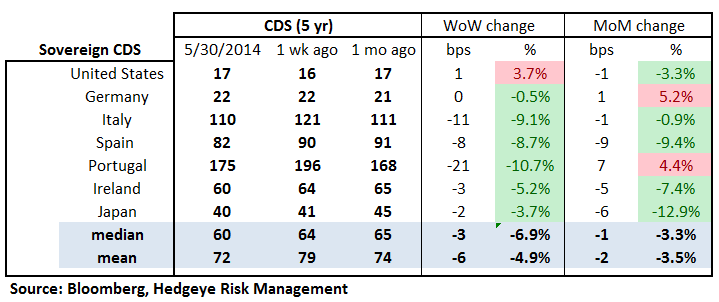
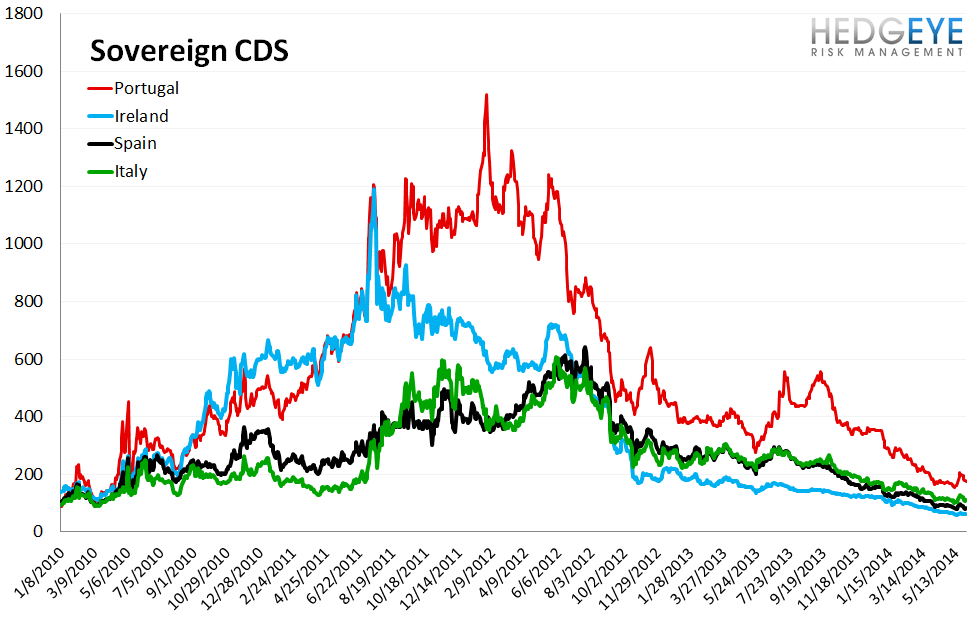
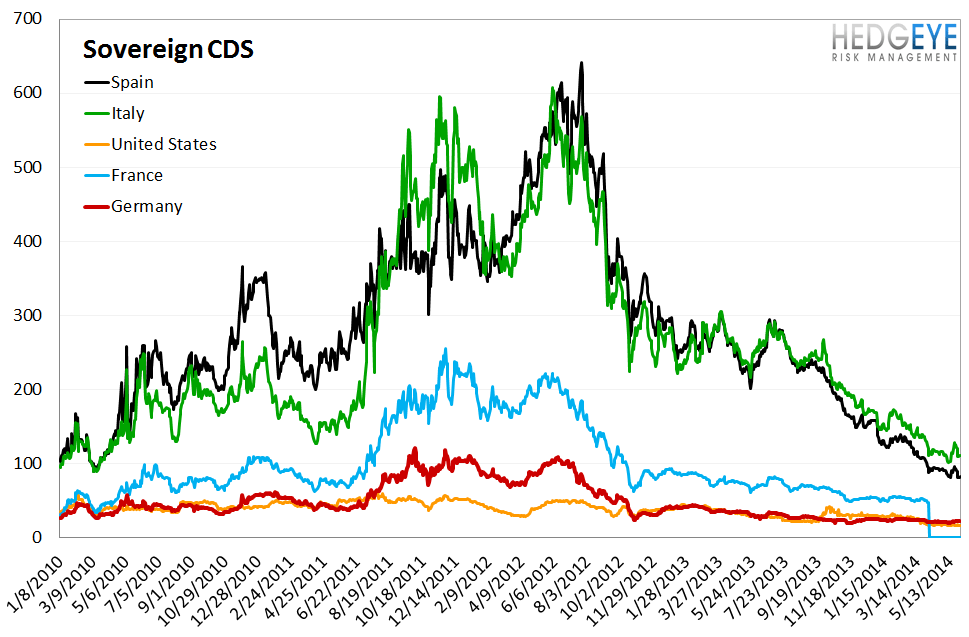
4. Sovereign CDS – Sovereign swaps were tighter across the board last week except for in the US, where they widened by 1 basis point to 17 bps. Portugal and Italy tightened the most, falling by 21 and 11 bps, respectively.
5. High Yield (YTM) Monitor – High Yield rates fell 8.3 bps last week, ending the week at 5.44% versus 5.53% the prior week.
6. Leveraged Loan Index Monitor – The Leveraged Loan Index rose 2.0 points last week, ending at 1,872.

7. TED Spread Monitor – The TED spread fell 0.2 basis points last week, ending the week at 19.4 bps this week versus last week’s print of 19.64 bps.

8. CRB Commodity Price Index – The CRB index fell -0.8%, ending the week at 305 versus 308 the prior week. As compared with the prior month, commodity prices have decreased -0.5% We generally regard changes in commodity prices on the margin as having meaningful consumption implications.

9. Euribor-OIS Spread – The Euribor-OIS spread (the difference between the euro interbank lending rate and overnight indexed swaps) measures bank counterparty risk in the Eurozone. The OIS is analogous to the effective Fed Funds rate in the United States. Banks lending at the OIS do not swap principal, so counterparty risk in the OIS is minimal. By contrast, the Euribor rate is the rate offered for unsecured interbank lending. Thus, the spread between the two isolates counterparty risk. The Euribor-OIS spread widened by 1 bps to 20 bps.

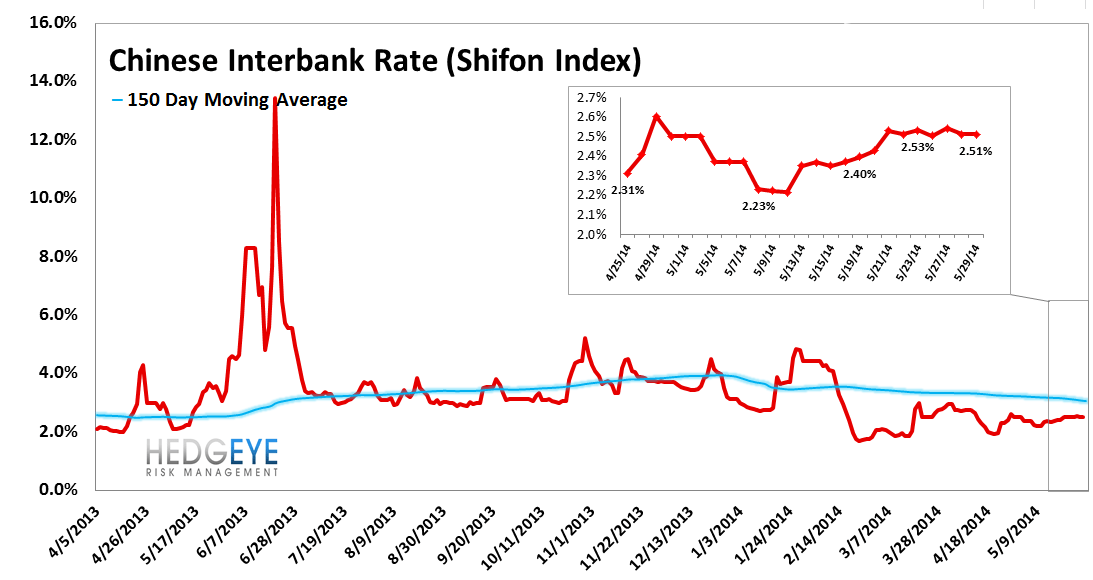
10. Chinese Interbank Rate (Shifon Index) – The Shifon Index fell 2 basis points last week, ending the week at 2.51% versus last week’s print of 2.53%. The Shifon Index measures banks’ overnight lending rates to one another, a gauge of systemic stress in the Chinese banking system.
11. Chinese Steel – Steel prices in China rose 0.4% last week, or 12 yuan/ton, to 3,233 yuan/ton. We use Chinese steel rebar prices to gauge Chinese construction activity, and, by extension, the health of the Chinese economy.

12. 2-10 Spread – Last week the 2-10 spread tightened to 210 bps, -9 bps tighter than a week ago. We track the 2-10 spread as an indicator of bank margin pressure.
13. XLF Macro Quantitative Setup – Our Macro team’s quantitative setup in the XLF shows 0.5% upside to TRADE resistance and 1.2% downside to TRADE support.

Joshua Steiner, CFA
Jonathan Casteleyn, CFA, CMT
