This note was originally published September 12, 2013 at 07:49 in Financials
Investment Company Institute Mutual Fund Data and ETF Money Flow:

Equity mutual fund inflow accelerated week-to-week to $903 million for the 5 day period ending September 4th, up from the $300 million inflow the week prior
Fixed income mutual fund outflows also improved but still resulted in a $6.7 billion withdrawal by investors, an improvement from the $9.1 billion draw down last week
Within ETFs, passive equity products experienced an outsized redemption of $11.3 billion, the second week in three weeks with over a $10 billion withdrawal. Bond ETF flows snapped into positive territory week-to-week with a $2.4 billion inflow this week compared to the $935 million outflow last week

For the week ending September 4th, the Investment Company Institute reported improvements in both equity and fixed income mutual fund flows however with bond trends simply booking a smaller outflow. Total equity fund flow totaled a $903 million inflow which broke out to a $1.5 billion inflow into international equity products and a $694 million outflow in domestic stock funds. These trends were an improvement from the prior week's total equity fund inflow of $300 million. Including this acceleration in stock fund flows, the year-to-date weekly average for 2013 now sits at a $2.6 billion inflow for total equity mutual funds, a substantial improvement from the $3.0 billion outflow averaged per week in 2012.
On the fixed income side, outflow trends continued for the week ending September 4th with the aggregate of taxable and tax-free bond funds combining to lose $6.7 billion in fund flow. The taxable bond category specifically shed $4.7 billion in the most recent period versus the $6.3 billion loss last week. Tax-free or municipal bonds continued their sharp outflow trends losing another $2.0 billion in the week ending September 4th, continuing its trend from last week which experienced a $2.9 billion outflow. Franklin Resources (BEN) continues to have the most exposure in our coverage group to declining Municipal bond trends with over 10% of its assets-under-management in the tax-free category. The 2013 weekly average for fixed income fund flow has now drastically declined from 2012, now averaging a $324 million weekly outflow this year, a far cry from the $5.8 billion weekly inflow averaged last year.
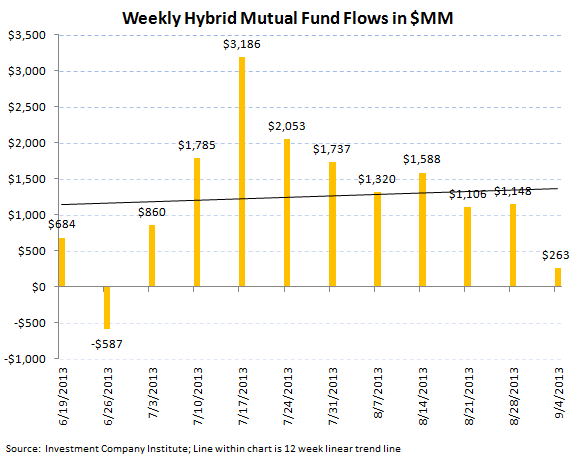
Hybrid funds, or products that combine both fixed income and equity allocation, continue to be the most stable category bringing in another $263 million in the most recent weekly period although dipping below the $1 billion weekly inflow level for the first time in 8 weeks. The year-to-date weekly average inflow for hybrid products is now $1.6 billion for '13, almost a 100% increase from 2012's $911 million weekly average.


Passive Products - A Big Equity ETF Outflow versus a Stable Fixed Income Inflow:
Exchange traded funds experienced mixed trends for the week ending September 4th with a massive equity outflow and a stable fixed income inflow. Equity ETFs lost $11.3 billion, the second biggest equity ETF outflow in 5 years next to the $12.9 billion outflow two weeks ago and only the 11th negative week in the 36 weeks of 2013. Despite this week's outflow, 2013 weekly average equity ETF trends are averaging a $2.6 billion weekly inflow, an improvement from last year's $2.2 billion weekly inflow average.
Bond ETFs conversely had an improvement week-to-week with a strong $2.4 billion inflow, the biggest fixed income ETF inflow in 8 weeks, which compared to last week's $900 million outflow. Despite this improvement in the most recent period the 2013 weekly bond ETF average is now just a $345 million inflow for bond ETFs, much lower than the $1.0 billion average weekly inflow from 2012.


HEDGEYE Asset Management Thought of the Week - The Bigger Base of Numbers:
Despite the $116 billion fixed income fund outflow that has occurred since the end of May, the largest absolute bond outflow in history, we point out that on a percentage of beginning fixed income assets-under-management that the current 2013 draw down is the smallest in history on a percentage basis. The 2013 running outflow has been just 2.9% of outstanding bond funds, well below the past outflows in 2003-2004 where 5.0% of outstanding bond funds were redeemed and the 14% of bond funds that were drawn down in the 1994-1995 outflow. 1999-2000 experienced a similar 5.0% redemption of outstanding bond funds, inline with the 2003-2004 fixed income sequence.
In our recent initiation of the asset management sector, we forecasted that a $1 trillion shift out of bonds and into equities could occur (this would include ETFs and single holdings of individual bonds in addition to bond funds) taking in consideration that bond outstandings in the U.S. are at new record highs and that modified duration, the return of volatility in fixed income, and the lack of liquidity in the bond markets would dislodge the asset class. The enclosed links present this initiation again:
http://docs.hedgeye.com/HE_F_AssetMgmt_launch.pdf
http://docs.hedgeye.com/DomesticAssetManagementCoverage_07.29.13.pdf

Jonathan Casteleyn, CFA, CMT
203-562-6500
Joshua Steiner, CFA
203-562-6500
