This note was originally published at 8am on May 21, 2013 for Hedgeye subscribers.
“A system can become locally ordered at the expense of a global increase in entropy.”
-Eric Chaisson
First, my family’s thoughts and prayers go out to the those personally affected by the natural disaster in Oklahoma.
Last week I wrote a note titled Sovereign Yield Risk that generated a lot of feedback. Since we put the Hedgeye platform at the heart of a wide open global network, feedback has become our greatest asset. Our research team has its own internal pipes of communication, but they don’t work unless we connect them to our client pipes and the new highway of dynamic information flow: #Twitter.
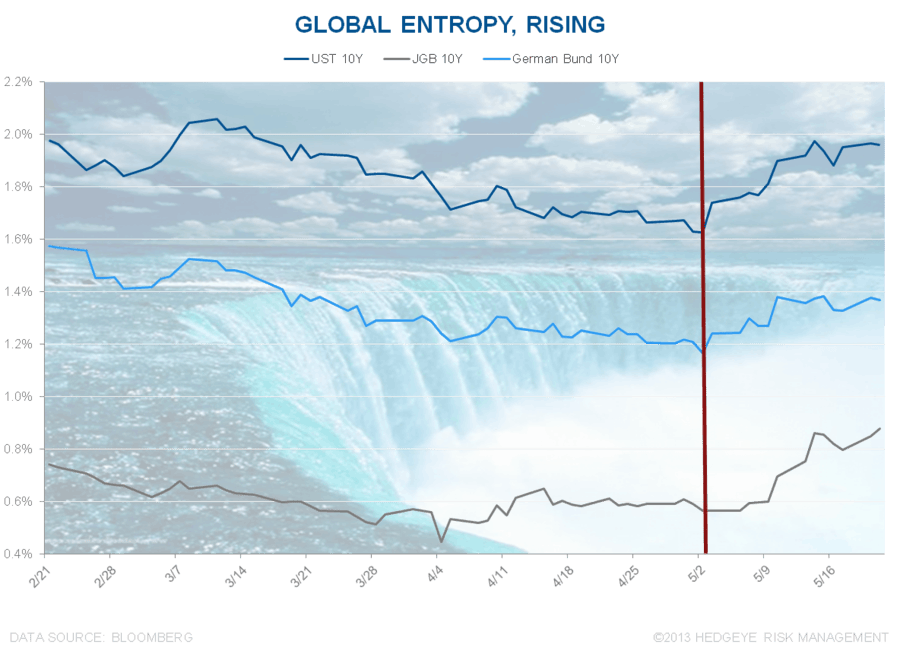
Both information and asset allocation flows matter to us, big time. Alongside price and volatility, they are critical factors that help us risk weight the probability of new bursts of entropy into the Global Macro matrix. Japanese Government Bond Yields breaking out above our long-term TAIL risk line would qualify as a new burst; so would a move toward 2.4% in 10yr US Treasury Yields.
Back to the Global Macro Grind…
The recent 1-month move in both JGBs (we’re short them) and US Treasury Yields are 2 of the 3 most important things in my notebook this morning. The 3rd is gold. And all 3 of these major macro factors are interconnected to a causal factor with a catalyst.
Let’s review what I am looking at this morning:
- Japanese Government Bond Yields (10yr JGBs) = up another +5 bps to 0.89% this morning; +31bps in the last month
- US Treasury Yields (10yr) = up +1 basis point this morning to 1.96%; +25bps in the last month
- Gold continues to crash from its 2011 #BernankeBubble top, backing off -0.5% this morning after a 1-day dead cat bounce
As always, contextualizing these moves across our multi-duration model matters too:
- JGB long-term TAIL risk line = 0.81% (so we’re breaking out above that)
- UST 10yr long-term TAIL risk line = 1.82%
- Gold snapped its long-term TAIL risk line of $1681 in January (not new)
You can ignore the entropy associated with 1 or 2 of these TAIL lines snapping (I hope you didn’t ignore our Gold signal 6 months ago), but it’s really hard to ignore all 3 of them; especially when the mother of all bursts of entropy (#StrongDollar) is in motion.
What matters most in macro is what happens on the margin. That’s why Ben Bernanke acknowledging what we have been signaling on employment, housing, and consumption #GrowthAccelerating will matter in his testimony to Congress tomorrow. That’s your catalyst.
To be fair to the #EOW (end of the world) guys, their thesis remains what ours was during Bernanke’s 2010-2012 QE marketing campaign. Consensus doesn’t think we will ever have real (inflation adjusted) growth in the USA again primarily because QE didn’t deliver it.
Ironically, but not surprisingly, the end of QE is the economic catalyst we’ve all been waiting for. #StrongDollar, Strong America.
To review the flow show:
1. Expectations for incremental QE fade
2. #StrongDollar manifests; Gold crashes
3. Bond Yields rise
Like the thermodynamics of water flowing toward (and over) a damn, the flow show is happening in a locally ordered pattern – and the global burst of entropy (the waterfall) is going to be very hard to stop.
I don’t think mother Merrill explains flows this way, but that’s cool – I just want them to keep telling their clients to sell Gold, Treasuries, and Japanese Government Bonds so that they don’t get run-over by the only centrally planned bubbles that are left.
Mr. Macro Market gets this – look at the most recent burst of immediate-term entropy (3 week correlations):
- US Dollar vs SP500 = +0.91
- US Dollar vs 10yr UST Yield = +0.92
- US Dollar vs Gold = -0.87
And since 3 weeks don’t matter to “long-term” investors, what if you contextualize 3 weeks within a 6 month TREND?
- US Dollar vs SP500 correlation (on a 6 month duration) = +0.79
- US Dollar vs 10yr UST Yield correlation (6 months) = +0.11
- US Dollar vs Gold correlation (6 months) = -0.78
In other words, one of these 3 things (UST Treasury Yields) does not look like the others (SP500 and Gold) on a 6-month duration, yet. But that’s precisely the risk management point – the probability of US Treasuries and JGBs correlating with #StrongDollar at an accelerating rate is now going up, not down. That’s new.
Can Bernanke not acknowledge both the economic growth stabilization of the last 6 months and the recent acceleration in US employment, housing, and consumption growth? Sure. I can have some IRS dude tell me the sun doesn’t rise in the East too – but that doesn’t mean I (or the market) has to believe them.
Our immediate-term Risk Ranges for Gold, Oil (Brent), US Dollar, USD/YEN, UST 10yr Yield, VIX, Russell2000, and the SP500 are now $1339-1421, $101.27-105.31, $83.49-84.75, 101.42-104.48, 1.90-2.02%, 12.22-13.79, 980-1004, and 1647-1678, respectively.
Best of luck out there today,
KM
Keith R. McCullough
Chief Executive Officer