Claims: Does Not Compute
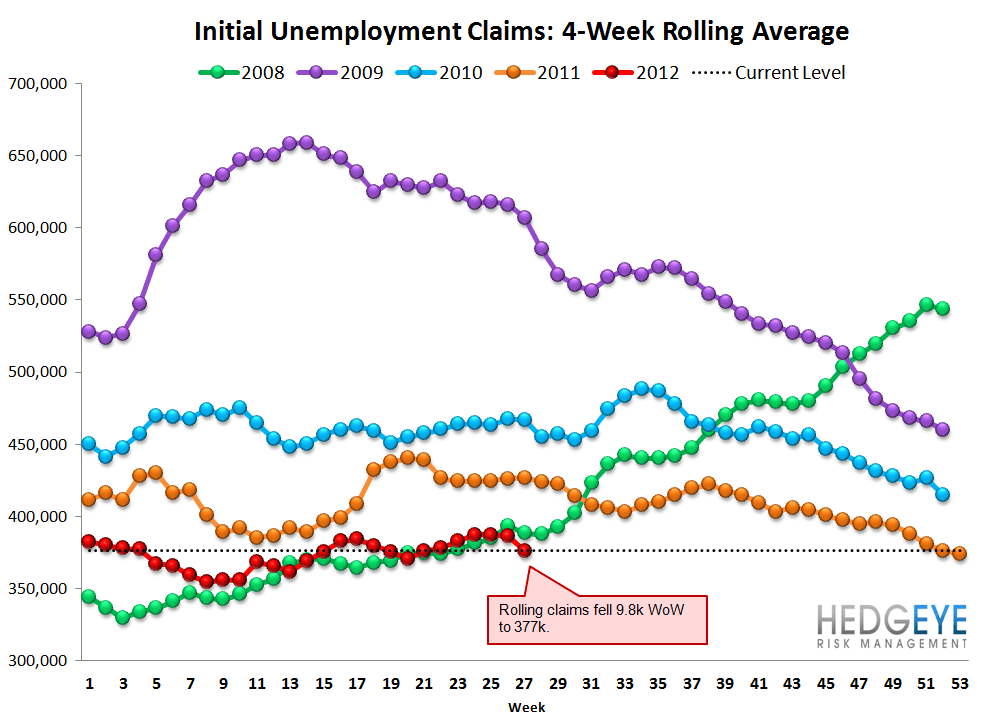
The headline print is that seasonally adjusted initial jobless claims fell 24k in the most recent week to 350k. Meanwhile, rolling claims fell 10k WoW to 377k. We wouldn't get too excited about this print for a couple reasons.
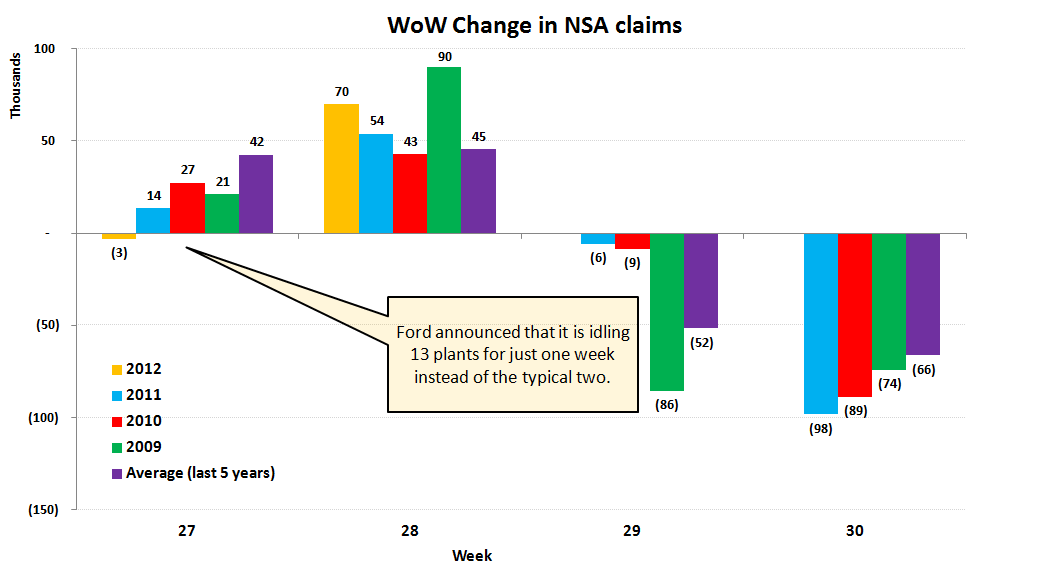
First, consider the distortion that's being created by the automakers. As we noted in our post last week, Ford announced earlier this year their intentions to idle 13 manufacturing plants for just one week instead of the typical two. Workers are allowed to collect benefits during this recurring annual furlough. This has the effect of making jobless claims appear significantly stronger than they are.
What's interesting about this morning's number is that the non-seaonally adjusted print was higher WoW by 70k. We show this in the first chart below. That compares with an average increase of 45k in the comparable week over the last five years. As such, it's a bit of a head scratcher how the SA print came in as well as it did. We would expect an extremely sharp reversal over the next two weeks. You can see this in our second chart below. Look at the last two weeks in the current year and look at the comparable periods in prior years.
On a YoY basis, NSA claims continue to improve at ~8%. This is the most straightforward measure of evaluating the underlying trend.


The 2-10 Spread
The 2-10 spread tightened another 8 bp WoW to 124 bps, as the ten-year treasury yield fell 11 bps to 152 bps.


Financial Subsector Performance
The table below shows the stock performance of each Financial subsector over four durations.


Joshua Steiner, CFA
Robert Belsky
Having trouble viewing the charts in this email? Please click the link at the bottom of the note to view in your browser.
