Key Takeaways
* Default probabilities rising globally. European sovereign CDS widened across the board last week. Simlarly, nearly all European Bank credit default swaps widened last week. Italian and French banks saw their spreads widen by double digits WoW. Domestic bank CDS followed suit.
* Junk bonds signaling trouble. High yield rates rose 53 bps last week to 7.65%, underscoring increased risk in the market.
* Muni debt default risk on the rise. The MCDX, our preferred measure of municipal credit risk, rose sharply last week.
* It has been a while since we've seen this many risk indicators flashing red on the short and intermediate term durations.
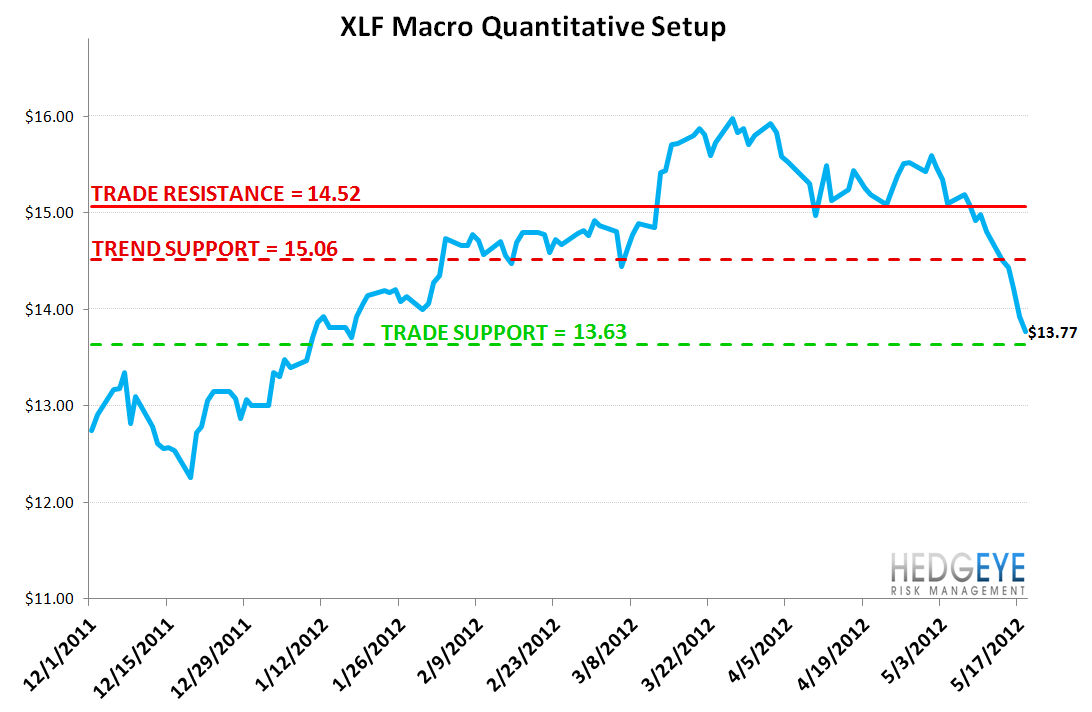
* If there's a silver lining, our macro team's quantitative model shows that the XLF has 5.4% upside to immediate-term resistance and only 1.0% downside to immediate term support.
Financial Risk Monitor Summary
• Short-term(WoW): Negative / 0 of 12 improved / 8 out of 12 worsened / 4 of 12 unchanged
• Intermediate-term(WoW): Negative / 3 of 12 improved / 7 out of 12 worsened / 2 of 12 unchanged
• Long-term(WoW): Neutral / 3 of 12 improved / 3 out of 12 worsened / 6 of 12 unchanged

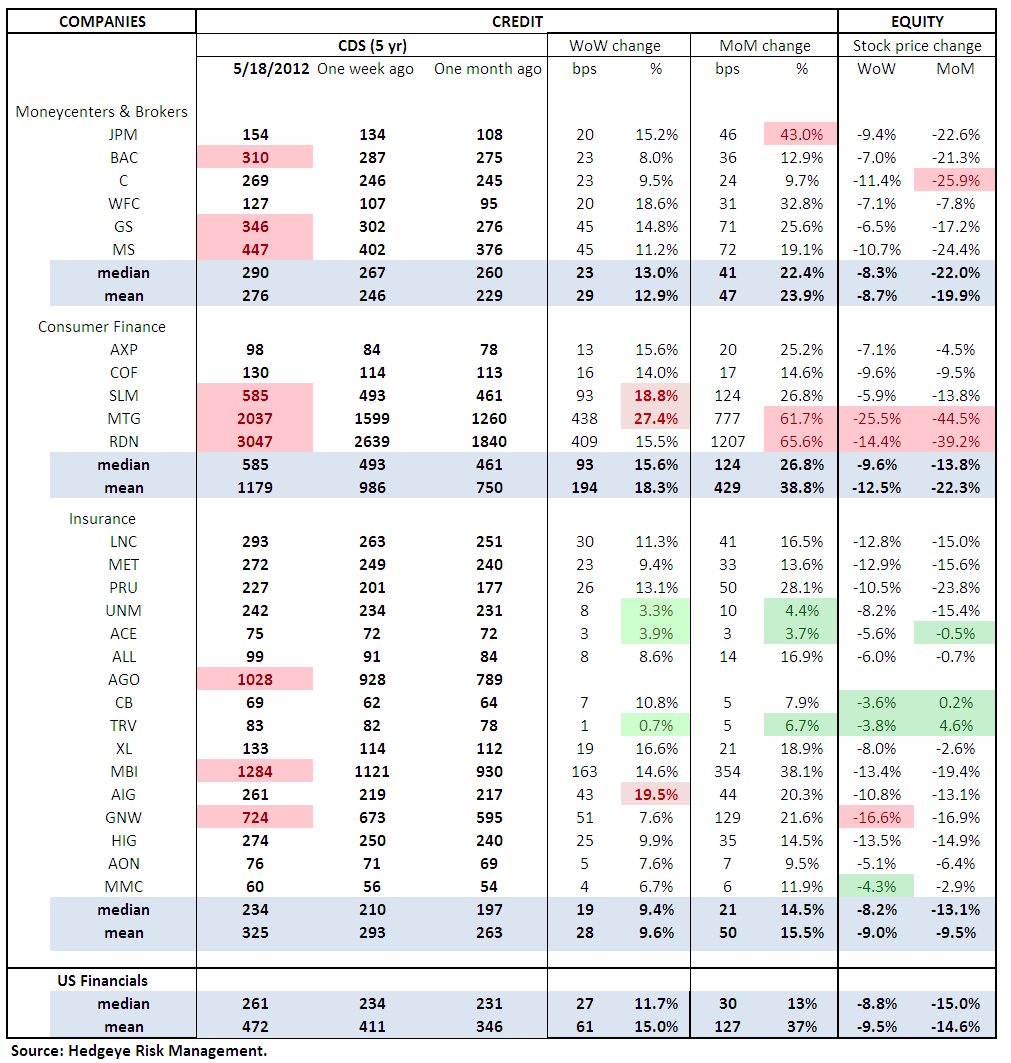
1. US Financials CDS Monitor – Swaps widened for every domestic financial company reference entity we track last week. MS ended the week at 447 bps, up 45 bps, GS ended at 346 bps, also up 45 bps.
Widened the most WoW: SLM, MTG, AIG
Widened the least WoW: UNM, ACE, TRV
Widened the most MoM: MTG, RDN, JPM
Widened the least MoM: UNM, ACE, TRV
2. European Financial CDS - Bank swaps were wider in Europe last week for 38 of the 39 reference entities we track. Notably, French banks widened dramatically. Societe Generale widened by 65 bps to 402 bps while Credit Agricole widened by 69 bps to 404 bps. The debt markets are casting their vote on the outcome of the French elections. Meanwhile, Italian bank swaps weren't far behind with increases of 48 to 97 bps week-over-week. Spanish banks were wider as well, though more modestly than their French or Italian counterparts.
We've also included a few Chinese banks for reference at the bottom of the table, and we will be soon rolling a table of Asian Financial CDS. The three Chinese banks we track showed week over week increases, but are generally trading in the low-200 bps range.

3. European Sovereign CDS – European sovereign swaps also widened across the board last week. Spanish sovereign swaps widened the least on a percentage basis (+2.3%) to 554 bps, while Irish sovereign swaps widened the most by 15.8% to 712 bps.


4. High Yield (YTM) Monitor – High yield rates rose sharply last week, increasing by 53 bps to end the week at 7.65% versus 7.11% the prior week.

5. Leveraged Loan Index Monitor – Following high yield's lead, the leveraged loan index posted its sharpest decline since mid-2011, dropping 23 points last week 1652.

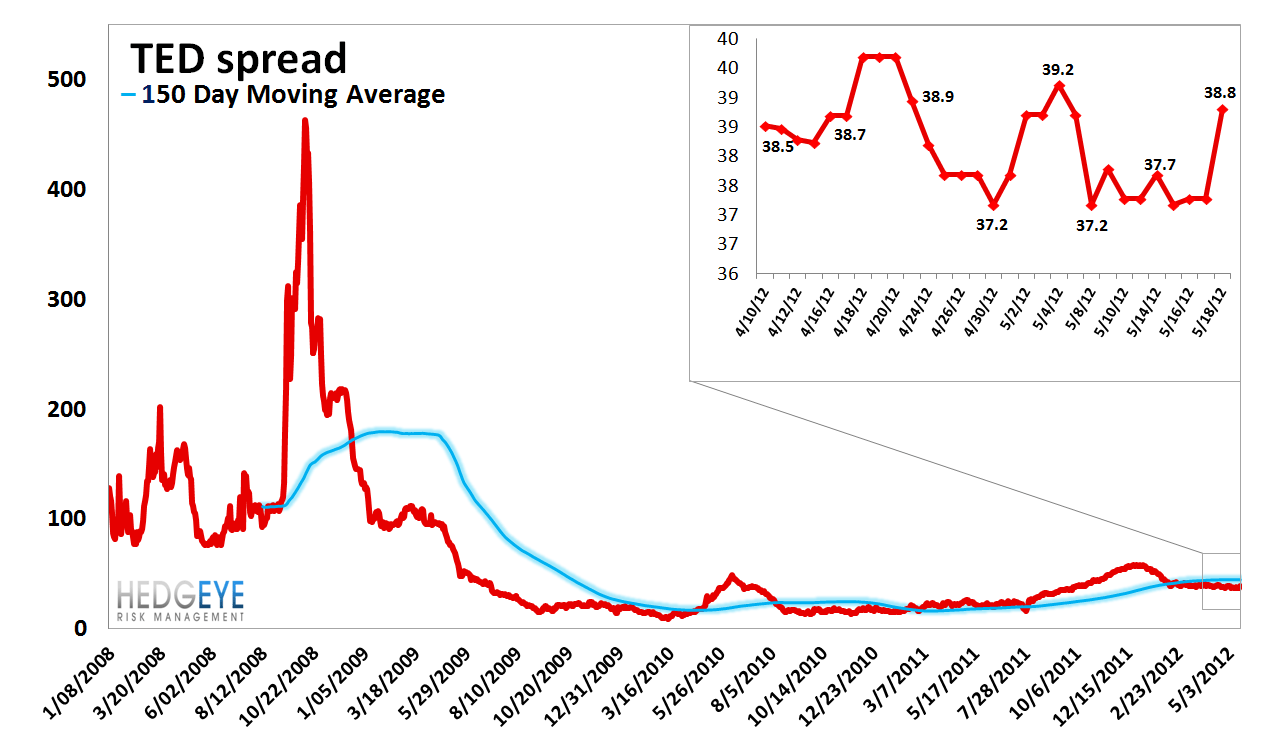
6. TED Spread Monitor – The TED spread rose 1.5 bps last week, ending the week at 38.8 bps versus last week’s print of 37.3 bps.
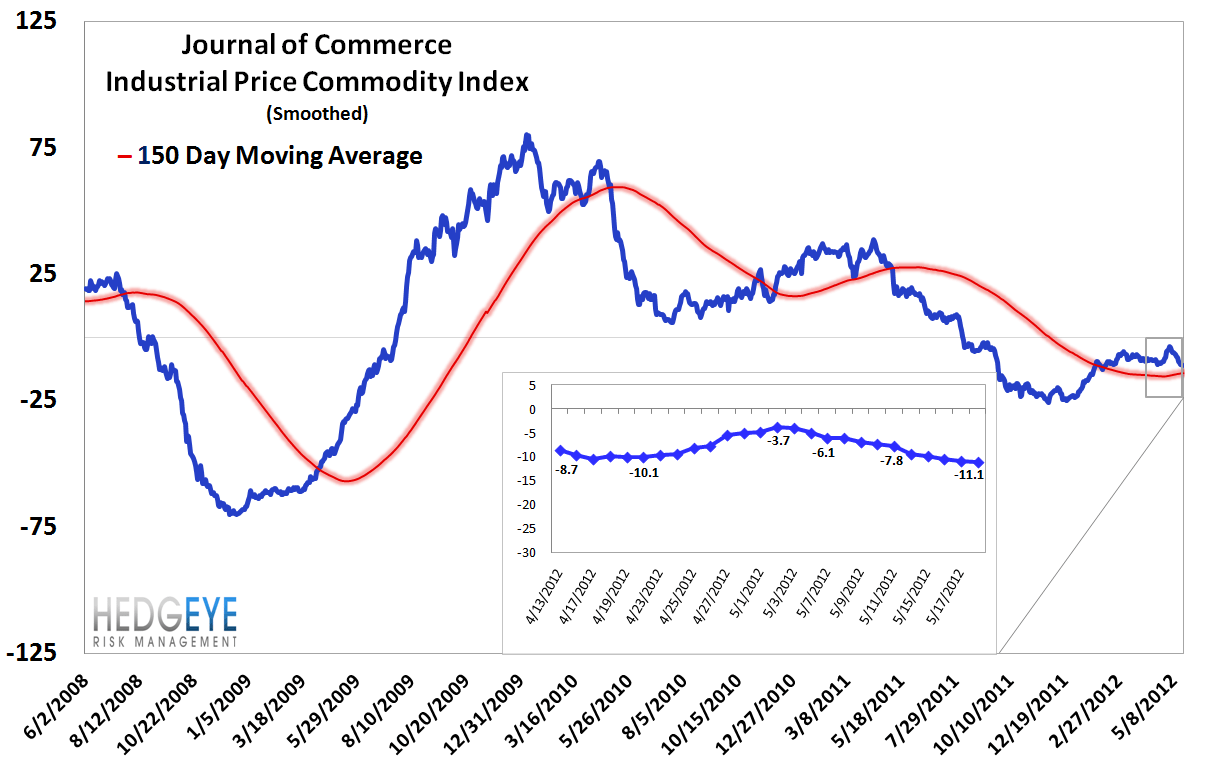
7. Journal of Commerce Commodity Price Index – Commodity prices continued to cool off reflecting the strengthening dollar. The JOC index fell 3.3 points, ending the week at -11.1 versus -7.8 the prior week.
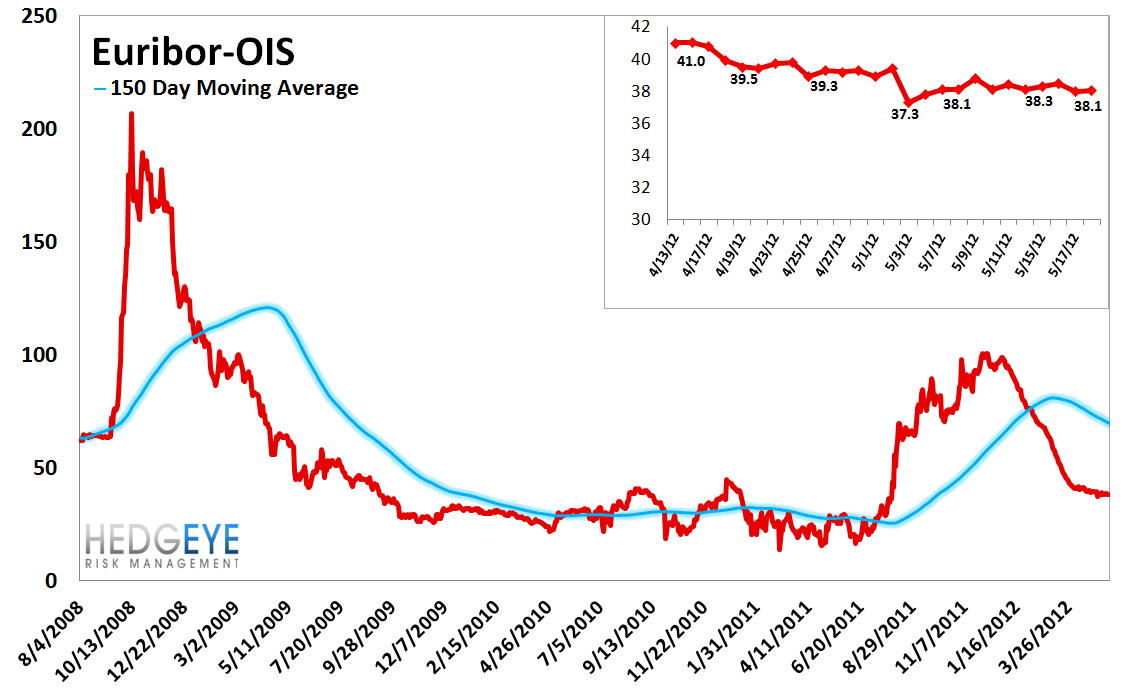
8. Euribor-OIS spread – The Euribor-OIS spread (the difference between the euro interbank lending rate and overnight indexed swaps) measures bank counterparty risk in the Eurozone. The OIS is analogous to the effective Fed Funds rate in the United States. Banks lending at the OIS do not swap principal, so counterparty risk in the OIS is minimal. By contrast, the Euribor rate is the rate offered for unsecured interbank lending. Thus, the spread between the two isolates counterparty risk. The Euribor-OIS spread was roughly flat over last week, ending the week at 38 bps.
9. ECB Liquidity Recourse to the Deposit Facility – The ECB Liquidity Recourse to the Deposit Facility measures banks’ overnight deposits with the ECB. Taken in conjunction with excess reserves, the ECB deposit facility measures excess liquidity in the Euro banking system. An increase in this metric shows that banks are borrowing more from the ECB. In other words, the deposit facility measures one element of the ECB response to the crisis.

10. Markit MCDX Index Monitor – The Markit MCDX is a measure of municipal credit default swaps. We believe this index is a useful indicator of pressure in state and local governments. Markit publishes index values daily on six 5-year tenor baskets including 50 reference entities each. Each basket includes a diversified pool of revenue and GO bonds from a broad array of states. We track the 16-V1. Last week spreads widened, ending the week at 167 bps versus 152 bps the prior week.

11. Baltic Dry Index – The Baltic Dry Index measures international shipping rates of dry bulk cargo, mostly commodities used for industrial production. Generally speaking, higher demand for such goods, as manifested in higher shipping rates, indicates economic expansion, though there are supply dynamics at play as well. Last week the index rose 3 points, ending the week at 1141 versus 1138 the prior week.

12. 2-10 Spread – We track the 2-10 spread as an indicator of bank margin pressure. Last week the 2-10 spread tightened a dramatic 16 bps to 143 bps.

13. XLF Macro Quantitative Setup – Our Macro team’s quantitative setup in the XLF shows 5.4% upside to TRADE resistance and 1.0% downside to TRADE support.
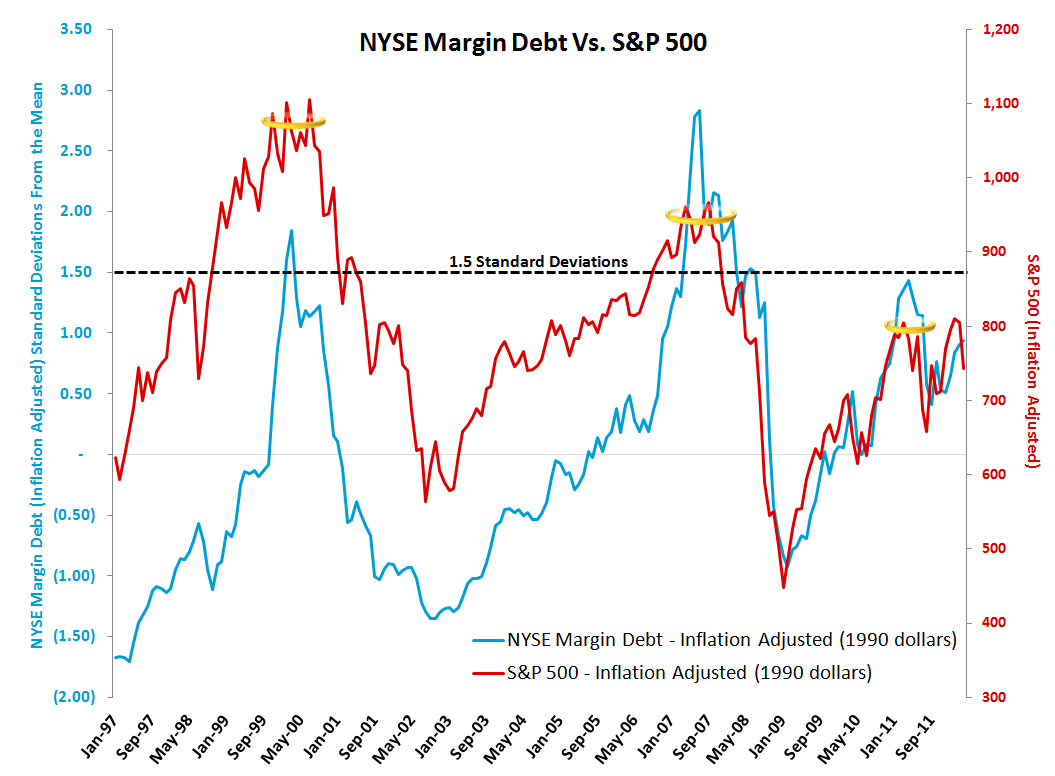
Margin Debt - April: +0.93 standard deviations
We publish NYSE Margin Debt every month when it’s released. NYSE Margin debt hit its post-2007 peak in April of 2011 at $320.7 billion. The chart below shows the S&P 500 overlaid against NYSE margin debt going back to 1997. In this chart both the S&P 500 and margin debt have been inflation adjusted (back to 1990 dollar levels), and we’re showing margin debt levels in standard deviations relative to the mean covering the period 1. While this may sound complicated, the message is really quite simple. First, when margin debt gets to 1.5 standard deviations or greater, as it did last April, it has historically been a signal of extreme risk in the equity market - the last two times it did this the equity market lost half its value in the ensuing period. We flagged this for the first time back in May 2011. The second point is that margin debt trends tend to exhibit high degrees of autocorrelation. In other words, the last few months’ change in margin debt is the best predictor of the change we’ll see in the next few months. We would need to see it approach -0.5 to -1.0 standard deviations before the trend runs its course. There’s plenty of room for short/intermediate term reversals within this broader secular move. Overall, however, this setup represents a long-term headwind for the market. One limitation of this series is that it is reported on a lag.
The chart shows data through April.
Joshua Steiner, CFA
Allison Kaptur
Robert Belsky
Having trouble viewing the charts in this email? Please click the link at the bottom of the note to view in your browser.
