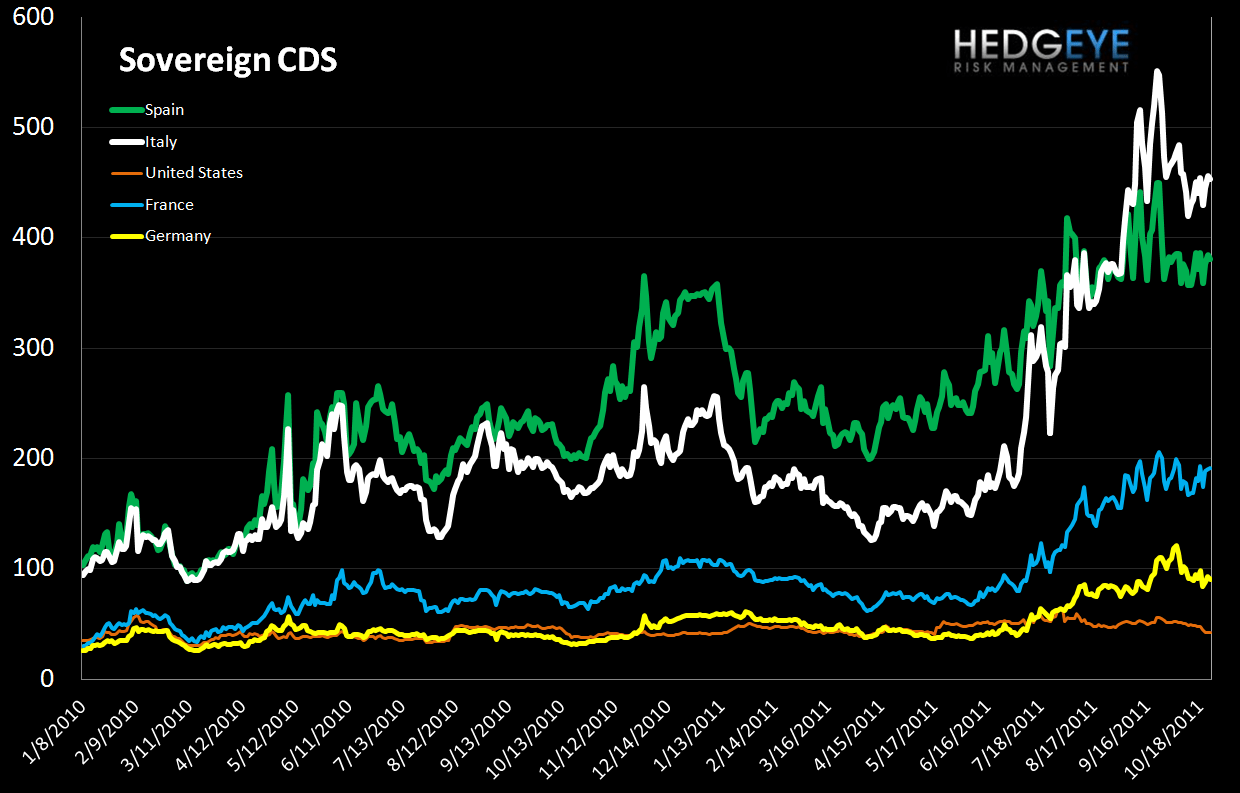
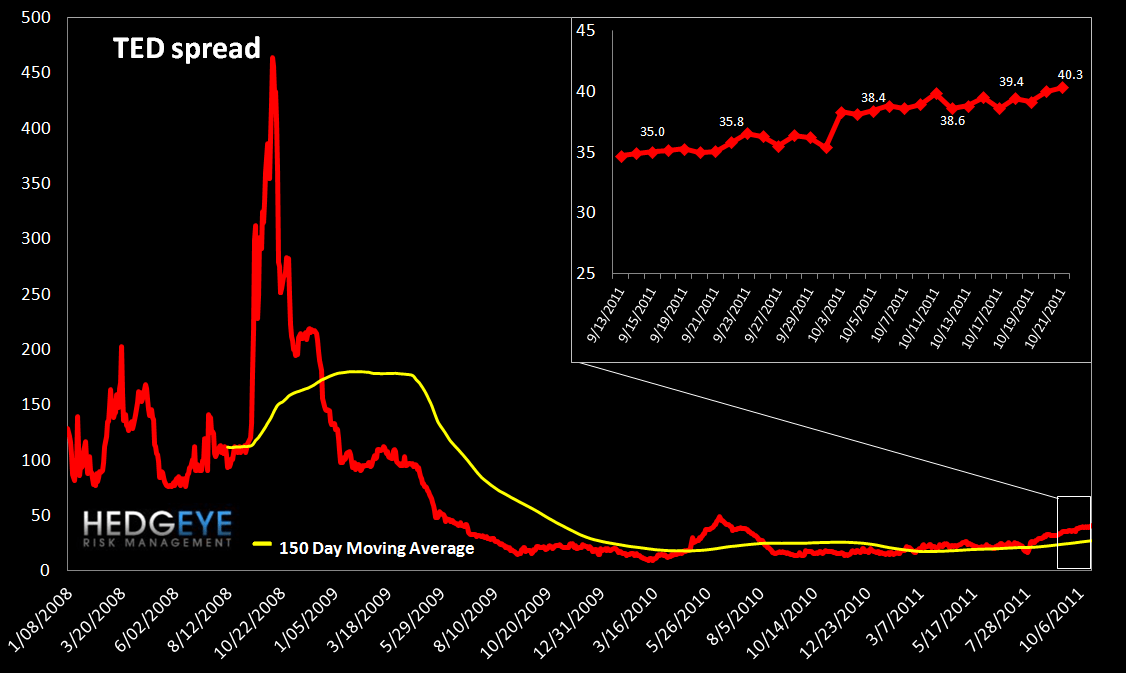
Credit default swaps for banks and sovereigns were slightly wider overall last week. French swaps widened the most among sovereigns, increasing 6.4% to 192. The TED spread made a new YTD high while the JOC index made a new YTD low.
Financial Risk Monitor Summary (Across 3 Durations):
- Short-term (WoW): Positive / 2 of 11 improved / 0 out of 11 worsened / 9 of 11 unchanged
- Intermediate-term (MoM): Positive / 4 of 11 improved / 1 of 11 worsened / 6 of 11 unchanged
- Long-term (150 DMA): Negative / 2 of 11 improved / 7 of 11 worsened / 2 of 11 unchanged

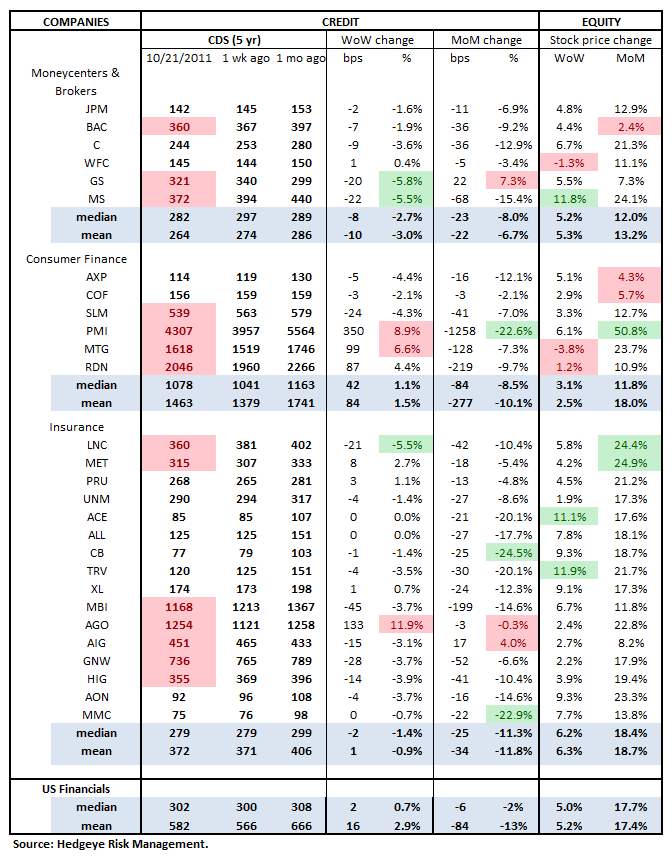
1. US Financials CDS Monitor – Swaps tightened across 18 of 28 major domestic financials last week.
Tightened the most vs last week: GS, MS, LNC
Widened the most vs last week: PMI, MTG, AGO
Tightened the most vs last month: PMI, CB, MMC
Tightened the Least/Widened the most vs last month: GS, AGO, AIG
2. European Financials CDS Monitor – Bank swaps were mixed in Europe last week, with swaps tightened for 21 of the 40 reference entities. Greek banks were the worst performers, as Alpha Bank A.E. and EFG Eurobank Ergasias S.A widened 30% and 15.2% respectively. German banks also saw deteriorations, with swaps widening an average of 7.5% WoW.

3. European Sovereign CDS – European sovereign swaps widened slightly last week. Only German and American spreads tightened. American spreads tightened by 12%. French swaps widened 6.4% to 192 from 180.

4. High Yield (YTM) Monitor – High Yield rates fell 36 bps last week. Rates retraced back to their late-September levels, ending the week at 8.13 versus 8.49 the prior week.

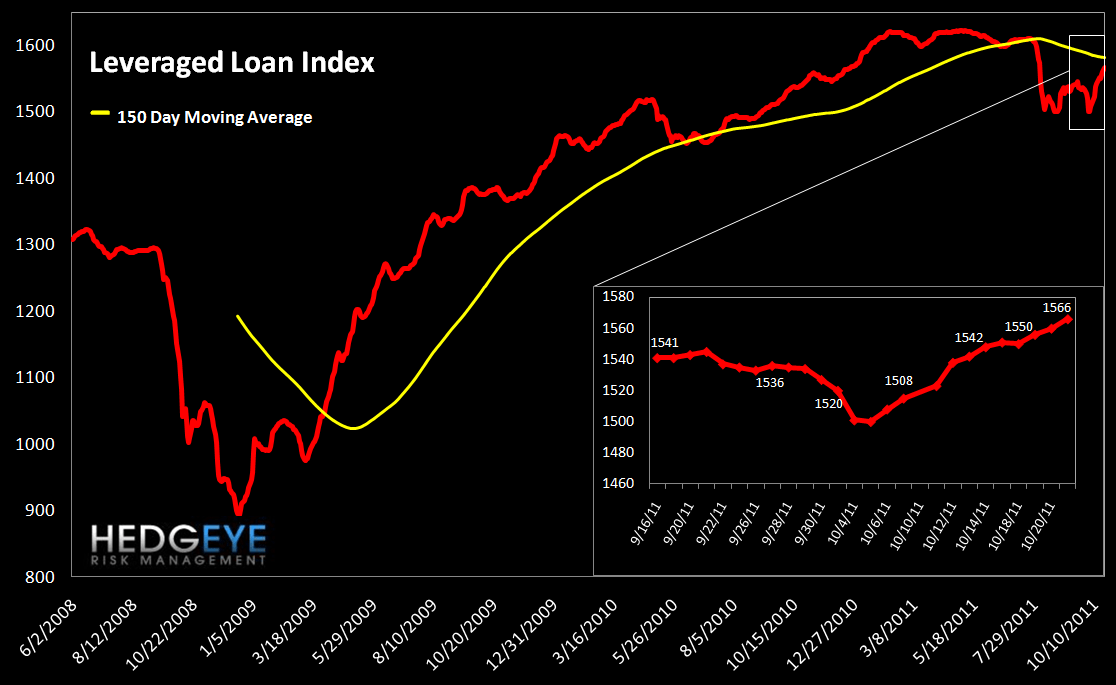
5. Leveraged Loan Index Monitor – The Leveraged Loan Index rose 18 points last week, ending at 1566.
6. TED Spread Monitor – Last week the TED spread hit another new YTD high, ending the week at 40.3 bps.
7. Journal of Commerce Commodity Price Index – The JOC index continued its decline, falling 3.3 points to end the week at -23.3.

8. Greek Yield Monitor – Last week the 10-year yield on Greek debt rose 11 bps to end the week at 2404 bps versus 2393 bps the prior week. Bond yields are currently just 164 bps off of their all-time high.

9. Markit MCDX Index Monitor – The Markit MCDX is a measure of municipal credit default swaps. We believe this index is a useful indicator of pressure in state and local governments. Markit publishes index values daily on six 5-year tenor baskets including 50 reference entities each. Each basket includes a diversified pool of revenue and GO bonds from a broad array of states. We track the 14-V1. Last week, spreads rose 1.3 bps and closed at 174 bps.

10. Baltic Dry Index – The Baltic Dry Index measures international shipping rates of dry bulk cargo, mostly commodities used for industrial production. Higher demand for such goods, as manifested in higher shipping rates, indicates economic expansion. Last week the index fell 20 points, ending the week at 2153 versus 2173 the prior week.

11. 2-10 Spread – We track the 2-10 spread as an indicator of bank margin pressure. Last week the 10-year yield fell to 2.22, pushing the 2-10 spread to 195 bps, 3 bps tighter than a week ago.

12. XLF Macro Quantitative Setup – Our Macro team’s quantitative setup in the XLF shows 1.8% upside to TREND resistance and 3.7% downside to TRADE support.

Margin Debt Falls in August
We publish NYSE Margin Debt every month when it’s released.
NYSE Margin debt hit its post-2007 peak in April of this year at $320.7 billion. The chart below shows the S&P 500 overlaid against NYSE margin debt going back to 1997. In this chart both the S&P 500 and margin debt have been inflation adjusted (back to 1990 dollar levels), and we’re showing margin debt levels in standard deviations relative to the mean covering the period 1. While this may sound complicated, the message is really quite simple. First, when margin debt gets to 1.5 standard deviations or greater, as it did this past April, that has historically been a signal of extreme risk in the equity market - the last two times it did this the equity market lost half its value in the ensuing period. We flagged this for the first time back in May of this year.
The second point is that margin debt trends tend to exhibit high degrees of autocorrelation. In other words, the last few months’ change in margin debt is the best predictor of the change we’ll see in the next few months. This is important because it means that margin debt, which has retraced back to +0.64 standard deviations as of August, still has a long way to go. We would need to see it approach -0.5 to -1.0 standard deviations before the trend reversed. We’ve dropped 230 S&P handles in getting from +1.5 standard deviations to +0.64 standard deviations. There’s plenty of room for short/intermediate term reversals within this broader secular move, but overall this setup represents a material headwind for the market.
One limitation of this series is that it is reported on a lag. The chart shows data through August.

Joshua Steiner, CFA
Allison Kaptur
