Initial Claims Fall Slightly
Initial Claims fell 2k to 422k last week (-6k after the upward revision to last week's data). Rolling claims dropped 14k to 425.5k. On a non-seasonally-adjusted basis, claims rose 5.6k to 377.4k.
We use claims as our primary frequency determinant in thinking about losses for the consumer book of balance sheet dependent financials. Thus, it is a critical signal that we remain right around the YTD high in rolling claims. (The last time we saw such an inflection in the trend in jobless claims was summer 2010, a period in which the XLF lost roughly 20% of its value.) Even with the XLF underperforming, we remain cautious given this continuing development on the jobs front. Specifically, it's our expectation that claims will, at best, stagnate post QE2's end and, at worst, rise. To this end, take a look at our fourth chart showing the overlay of jobless claims with S&P 500. The current divergence is among the widest we've seen in the last few years suggesting that either the market is due for a significant correction in the near-term or claims should fall precipitously in the next few weeks.


Two relationships that we are watching closely are the tight correlation between the S&P and claims and between Fed purchases (Treasuries & MBS) and claims. With the end of QE2 looming, to the extent that this relationship is causal, it is quite concerning.


This week we are adding a chart of initial claims and the XLF from 2009 to present.

Yield Curve Tightens 10 bps
We chart the 2-10 spread as a proxy for NIM. Thus far the spread in 2Q is tracking 10 bps tighter than 1Q. The current level of 250 bps is 10 bps tighter than last week.


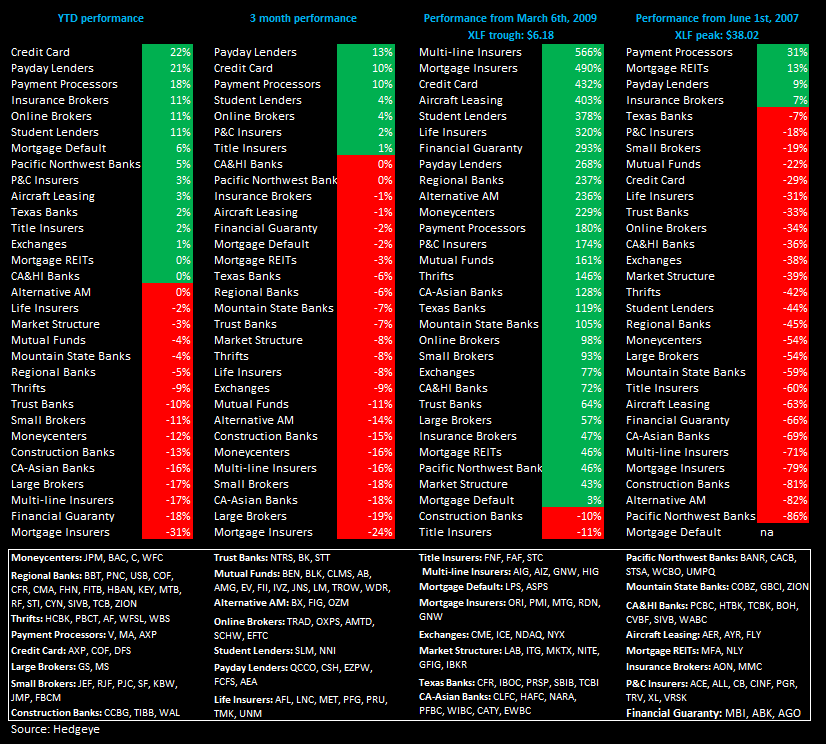
Financial Subsector Performance
The table below shows the stock performance of each Financial subsector over four durations.
Joshua Steiner, CFA
Allison Kaptur
