"It’s like Wiley Coyote (off the cliff) moments are emerging everywhere it seems…"
– Christian Drake
As a kid who grew up in the 1980s and watched too much television, I suspect that I’ve seen most, possibly all, of the episodes of Wile E. Coyote and the Road Runner. The episodes were all Shorts, typically with a run time of just 6-7 minutes – kind of like the 1980s version of TikTok – and they were always action-packed.
The creator and director of the series, Chuck Jones, wrote a book years later in which he explained that there were nine rules that governed every (well, almost all) episode. Rule #8 is great.
Rule #8 states, “Whenever possible, make gravity the Coyote’s greatest enemy.” For example, falling off a cliff.
What was great about those cliff scenes was the 2-3 second window during which Wile E. was suspended in mid-air before falling into an impossibly deep canyon and creating only a tiny puff of dust on impact. Of course, it wasn’t until he realized he was in mid-air and in danger that the reality of being in mid-air took hold, and only then did gravity run its course.
Versions of that same cartoon scenario are playing out in both the real economy and markets today.

Back to the Global Macro Grind…
Here’s a few real-world gravity dynamics to consider.
The pace of home price decline is currently running at 4-5x that seen during the GFC run-up. How so?
The M/M SAAR in the FHFA Home Price Series – a repeat sales index capturing the full GSE-conforming market – has, in just the last 3-4 months, slowed in RoC terms from +19% to -7% (M/M SAAR). That’s a 26-percentage point reversal in just 3-4 months.
In the run-up to the GFC, it took the same series close to 18 months to reverse from +10% to -10%, a 20-percentage point reversal. So, Housing Bubble of the ages unwinds 20 ppt in 18 months. Housing Bubble of today unwinds 26 ppt in 3-4 months.
Wile E.’s paw prints are there. There was a window of time in the Spring when rates were climbing (very) quickly, but the residual pent-up demand was so strong that it temporarily suspended gravity and enabled that 3-month mid-air standstill, only to finally give way this Summer/Fall to Rule #8.
A twitter user recently flagged a post about Twin Cities home builders reporting October Single Family New Construction Permit volumes being down -54% Y/Y. This compares with August and September SF volumes being down -27% and -28% Y/Y, and volumes from April being higher by +12% Y/Y. That’s 66-percentage points of reversal in 6 months. It was the slowest October for Twin Cities New Home construction in over a decade.
Next, consider the comments from the CEO of Camden Property Trust. He sits on the Board of Directors of the largest private homebuilder in the country, and he said that homebuilder’s “sales are down -50% from June forward, and they’re not going up.” (H/T @RickPalaciosJr).
Now consider Wells Fargo, which at one point accounted for one third of new home loans in the US, but today is merely the third largest US originator. The bank reported in Q3 that its mortgage origination volumes were down -60% Y/Y. However, recent news articles suggest that October volumes are down -90% Y/Y. Let that sink in. Down Ninety percent.
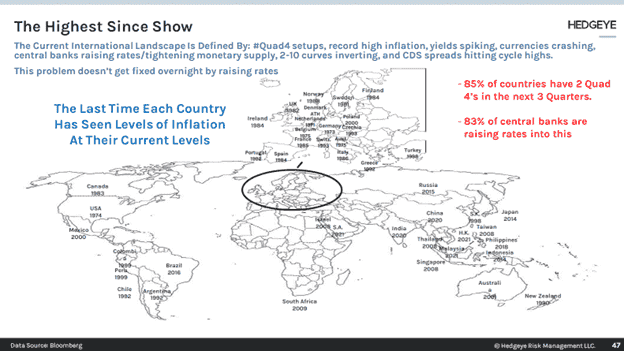
As we highlighted in our Q4 Macro Themes deck, much of the world is currently in a precarious position. While it is not atypical in Quad 4 for Central Banks to be tightening (since Q4 1997 there have been 20 quarters of Quad 4 and 10 of those were during periods of Fed tightening), what is atypical is the level of inflation afoot. Throughout the last 25 years, the typical inflation backdrop amid periods of Quad 4s in which policy was tightening was 3%. Three percent. Compare that to today’s 8%.
This is why Quad 4 environments historically have not tended to last long and why the markets have become repeatedly conditioned to expect the bounce. Central Banks normally move swiftly to usher in accommodative policy. The simultaneous slowing of RoC in both real economic growth and inflation demands as much. However, this is not a typical Quad 4 backdrop of low inflation.
Today, fully 85% of Countries around the world have 2 Quad 4’s in the next 3 Quarters while 83% of central banks are raising rates into this and most of these countries are facing a similar high-inflation backdrop. This is not the prescription that is normally written to cure Quad 4’s infection.
The back half of 2018 was somewhat analogous to today and is likely mistakenly serving as the playbook in that it too was a multi-quarter Quad 4 that also saw a tightening Fed. When the Fed finally paused in January 2019, equity markets rallied. The difference between then and now? Inflation was at 2.9% at mid-year 2018 and ended 2018 at 1.9%.
Today? Inflation is at 8.2% – yes, that is down from 9.1% in June (golf clap). The Fed’s target? Two percent.
Meanwhile, the labor market is going to serve as the Road Runner to the market’s Wile E. Coyote.
Job Openings most recently numbered fully 10.7 million, an increase from the 10.3 million last month, though down from the ATH of 11.9 million set back in March.
For perspective, pre-pandemic Job Openings stood at 7.2 million in January, 2020, which itself was far above the level (4.6 million) preceding the GFC downturn. During the GFC, openings fell to a trough of 2.2 million in July 2009 – a brutal process that took 18 months.
The interesting thing about that July 2009 Job Openings reading (2.2 million) is that it corresponded with a headline CPI reading of -2.0%. Yes, negative 2%. Actual deflation.
The nature of the lagged mechanics of CPI – which we have discussed repeatedly – were already going to keep the Fed committed to being hawkish longer than expected, but the labor market is going to be the real Road Runner in this scenario, leaving Wile E. Coyote (the market) to stand there, hanging in mid-air disbelief over the reality of the situation repeatedly.
The Fed is not going to receive any semblance of a white flag from either inflation or labor until, at the earliest, well into next Spring.
Nor is the Fed is going to be pushed toward early cessation simply by the ongoing fall in risk asset prices. That much was made crystal clear in Wednesday’s Fed presser. In fact, the Fed considers upside in risk assets antithetical to precisely what it is trying to accomplish by way of the Wealth Effect. That fact is perhaps the most Wile E. Coyote feature in all of this.
So where does that leave the bulls? Clearly, with only one hope. A full-blown Financial System Crisis.
Of course, be careful what you wish for. While such an event would indeed force the Fed’s hand from Vol Catalyst back to Vol Warden, it would come at a terrible cost that the market is currently mentally glass half-fulling and would run the risk of not arresting the declines quickly either.
Consider the GFC. Lehman’s collapse in September 2008 forced both the Treasury and Fed’s hands (Inflation was at 5.0% back then by the way), but it wasn’t until early March 2009 (~6 months later) that risk assets bottomed.
How did risk assets perform during that period of crisis and massive support/intervention? Well, from the end of August 2008 through the lows in early March 2009, the S&P 500 lost a further 48%. Yes, it got cut in half despite the Fed and Treasury’s best efforts.
Therefore, we caution investors to be careful not to wish for the Fed’s hand to be forced. It’s a classic case of pay me now (on the short side) or pay me later.
We stress these points repeatedly, but like post-cliff’s edge Wile E. Coyote in the 2-3 seconds before Gravity catches up, bulls remain hardwired in the conviction that the Fed will have their back just as it has repeatedly over the last two decades.
We would advise sticking to the process and fading the hopium/narratives. Dispassionately mapping the RoC through our probabilistic GIP framework while overlaying the price-volume-volatilty risk-adjusted signaling process – we would argue – has served our clients well thus far this year.
Immediate-term Risk Range™ Signal with @Hedgeye TREND signal in brackets:
UST 10yr Yield 3.94-4.30% (bullish)
UST 2yr Yield 4.35-4.77% (bullish)
High Yield (HYG) 70.97-74.31 (bearish)
SPX 3 (bearish)
NASDAQ 10,247-10,996 (bearish)
RUT 1 (bearish)
Tech (XLK) 117-129 (bearish)
Energy (XLE) 84.08-91.74 (bullish)
Consumer Staples (XLP) 69.09-73.90 (bullish)
VIX 23.99-30.92 (bullish)
USD 109.73-113.80 (bullish)
Oil (WTI) 84.14-91.84 (bullish)
Gold 1 (bearish)
To your continued Success,
Josh Steiner
Managing Director