


RISK ON - Adding YUMC as a LONG
We will be hosting a Black Book call to Discuss Yum China on 6/27 @ 10:00 AM (CLICK HERE for a calendar invite).
YUMC operates and manages casual dining and fast-food chains in China through the following segments: Kentucky Fried Chicken (78% of sales), Pizza Hut (21% of sales, and All Other Segments (1% of sales). The Pizza Hut segment covers Pizza Hut casual dining and Pizza Hut home service. The All Other segment includes Little Sheep, Huang Ji Huang, COFFii and JOY, East Dawning, Taco Bell, E-commerce business, and Lavazza. The company was spun out of YUM in November 2016 and is headquartered in Shanghai, China. Yum China shares have fallen more than 33.4% over the past year and 8.9% YTD. Yum China has struggled due to macroeconomic headwinds such as the increase in Covid-19 cases in China and the shutdown, among other issues. Based on the research coming from Felix Wang (@HedgeyeChina), China looks to be ain a "RISK ON environment in China. See his thoughts below:

Also, as Hedgeye CEO Keith McCullough said yesterday, China is "signaling immediate-term TRADE overbought within my Risk Range, but #Quad2 in Q3 (for China) is in play." YUMC is a strong performer in #Quad2 in China.
The financials of YUMC have been devastated over the past few years, but will still generate over $1.4B in EBITDA in 2022. We can see 35-55%+ upside in YUMC for the following reasons:
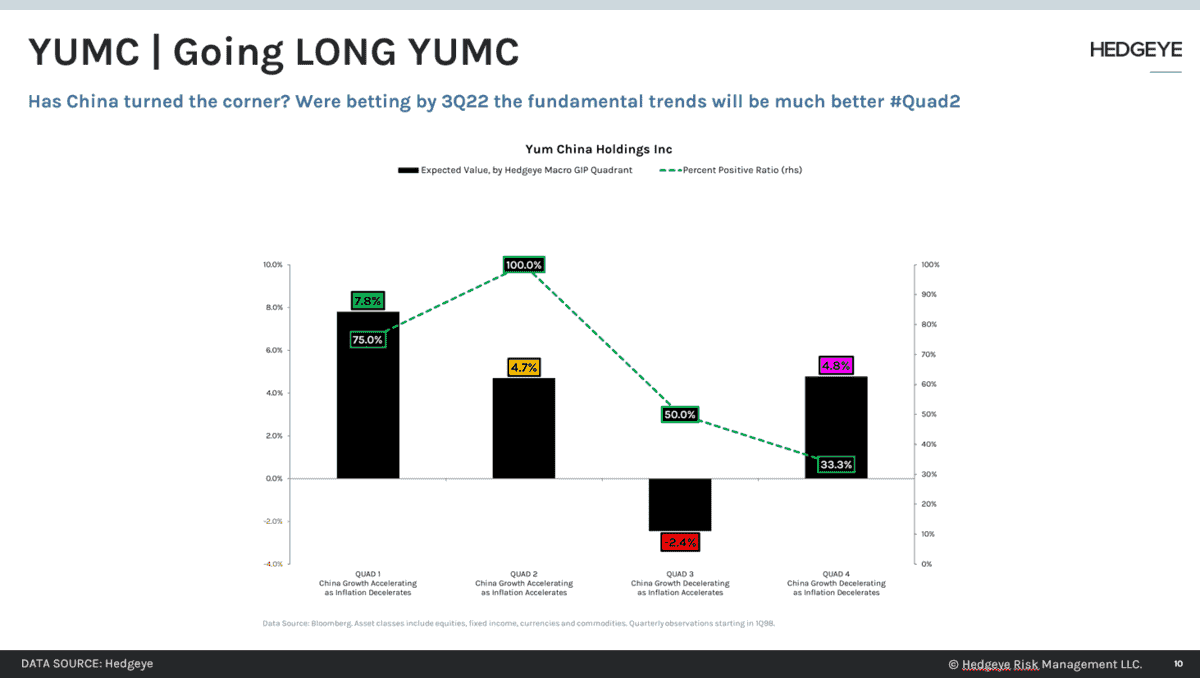
- The Hedgeye MACRO set up in china
- With 12,117 stores and 345M loyalty members in China, YUMC is a dominant restaurant company in China and operates two strong brands in the market with KFC and Pizza Hut.
- Due to the lockdowns, the company has preannounced terrible numbers for 2Q22, but there is a line of sight to improving results again easy comparisons in 2H22
- Strong Digital/Delivery presence; Technology first company

Knapp Track Sales
In MAY 2022 (2022 VS. 2021), at a USA level, HIGH-END STEAKHOUSES had a 14.7% comp sales increase and a 7.0% comp covers increase. For the U.S.A., MAY 2022 (2022 VS. 2021), 4 of 4 weeks had positive comparable restaurant sales results. 0 of 4 weeks in MAY 2022 had negative comparable restaurant sales results. The comp sales run rate for the first 2 weeks of MAY 2022, is 17.5%. The comp sales run rate for the last 2 weeks of MAY 2022 is 11.1%
HIGH-END STEAKHOUSES WEEKLY USA LEVEL DATA
COMP SALES COMP COVERS (Traffic)
Week ending MAY 08 22.1% 14.3%
Week ending MAY 15 12.9% 5.0%
Week ending MAY 22 14.9% 6.1%
Week ending MAY 27 7.2% 0.8%
Restaurant CAP Rates
A net positive for large casual dining chains
Investors who feared that diminished in-person dining during the pandemic would significantly impact store sales in single-tenant casual dining are finding that to not be the case, according to The Boulder Group's 2022 Net Lease Casual Dining Report issued last week. "The recovery experienced by the restaurant sector has brought net lease investors back to this category," Jimmy Goodman, Partner, The Boulder Group, said in prepared remarks. And rising cap rates are no longer on the net lease casual dining menu, as they decreased 6.03% in Q1, according to The Boulder Group. This represented a 70-basis point decrease when compared to the prior year. Casual dining properties with corporately guaranteed leases generated cap rates of 5.75%, while franchisee leased properties had cap rates of 6.40%. Cap rates for corporate guaranteed leases experienced 40 basis points of compression while franchisee lease properties decreased by 72bps. Randy Blankstein, President, of The Boulder Group, said better overall market conditions for the restaurant sector post-pandemic led to cap rate compression. "Investor interest and transaction velocity increased due to recovery for casual dining restaurants following the pandemic," Blankstein said. Leading Brands Expanding FootprintsSales in casual dining spiked more than 30% in 2021 compared to 2020 according to Technomic's Top 500. Only 30% of the casual dining restaurant brands exceeded their 2019 store sales. Strong corporate brands, including Olive Garden and Texas Roadhouse, have followed up the pandemic with significant expansion plans. The bid-ask spread compressed to 15 basis points in Q1, a sign of increasing competition amongst investors. Furthermore, according to the report, according to the report, corporate-backed leases are priced at a 65-basis point premium over their franchisee-backed counterparts.
