
As April data has appeared, the latter part of 1Q 2022 looks more like a change-up from COVID treatment dominating operations to more normal functions.
Hospitals operate at about 70% capacity, day in and day-out. During spikes in COVID, we saw some hospitals push into the upper 70s and lower 80s but generally it has been remarkably consistent. Those stable occupancy levels mean that COVID cases - which tend to be lower margin even with the 20% Medicare payment add-on - displaced other care. The crowding out effect by COVID cases has no doubt contributed to the persistent excess mortality we have highlighted for months.
Now that COVID has subsided in many geographies, there is room for scheduled procedures and any medical care that might have been previously diverted to home or another care setting. After nurses, the power center at most hospitals are the surgeons. Their work represents both more revenue and higher margins. Naturally, to the extent labor costs remain high, the preference for any hospital administrator is going to be a surgical case.
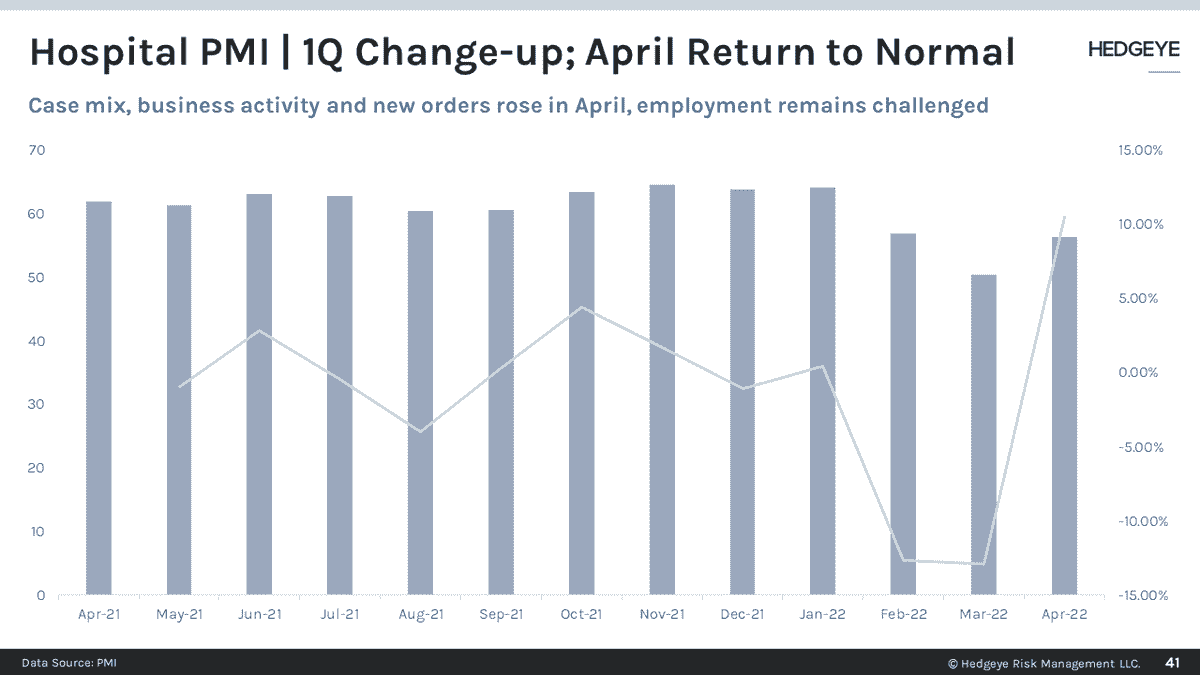
Most surgeries must be scheduled and with COVID's impact hard to predict day-to-day, may have been slow to back-fill. This thesis is born out by last week's PMI for hospitals. It is also supported by anecdotes all over town. The PMI report indicated an increase of 4% in case mix, from 43 to 47. New Orders and Business Activity both rose. The Employment Index remains challenged. Read it here.
Have a great day and let me know if you have any questions.
Emily Evans
Managing Director – Health Policy
Twitter
LinkedIn
