Below is a chart and brief excerpt from today's Early Look written by Director of Research Daryl Jones.
|
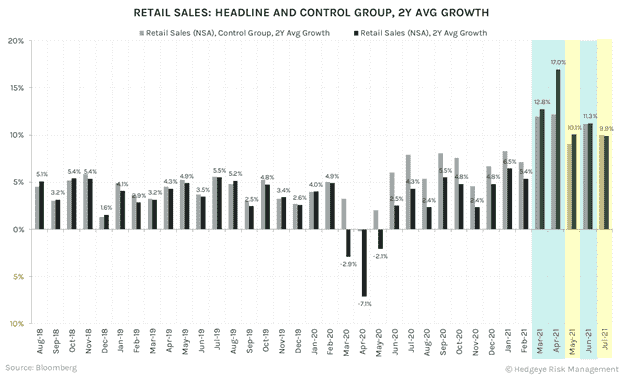
Now at headline value, the -1.1% decline from June was a sequential decline and a miss on the expectations of linear economists. But as the Chart of the Day highlights on a 2-year average growth basis, we are still running at near +10% Y/Y growth and up some +17.2% from pre-pandemic levels. Now this isn’t to say slowing retail sales and last week’s sharp deceleration in August’s Michigan Consumer Confidence, which came in at a -12.3% decline versus July, are data points to completely dismiss. In fact, they are very consistent with what we would expect in #Quad3. That is the growth decelerating component to this economic regime. |