HEDGEYE
Risk Range™ Signals
User Guide
Dear Risk Range™ Signals subscriber,
Most investors are motivated by greed and fear. You already know that. They invariably chase asset price bubbles higher and then capitulate when those bubbles pop. In other words, most investors fail to follow the most basic investing principle: Buy low, sell high.
There's a better way.
Our Risk Range™ Signals product is based on a proprietary model built on the price, volume and volatility of underlying assets. This tool was developed by our CEO Keith McCullough during his years as a hedge fund manager to augment his team's fundamental research views.
The idea was to create a quantitative risk management tool to help investors actually buy low and sell high.
Getting Started: How To Use Our Risk Range™ Signals
How It Works
The Risk Range™ Signals model uses price, volume and volatility to determine the likely immediate-term daily trading range for publicly-traded assets.
It's simple. You sell at the top end of the range and buy at the low end.
Concerned about hanging onto losing (or winning) investments too long? Remember: The immediate-term TRADE ranges are probable daily Risk Range™ Signals. In other words, instead of us opining about what we think the market should be doing, these Risk Range™ Signals are designed to change based on what the Market is actually doing, according to the underlying price, volume and volatility trends of that asset.
What You Get With Risk Range™ Signals
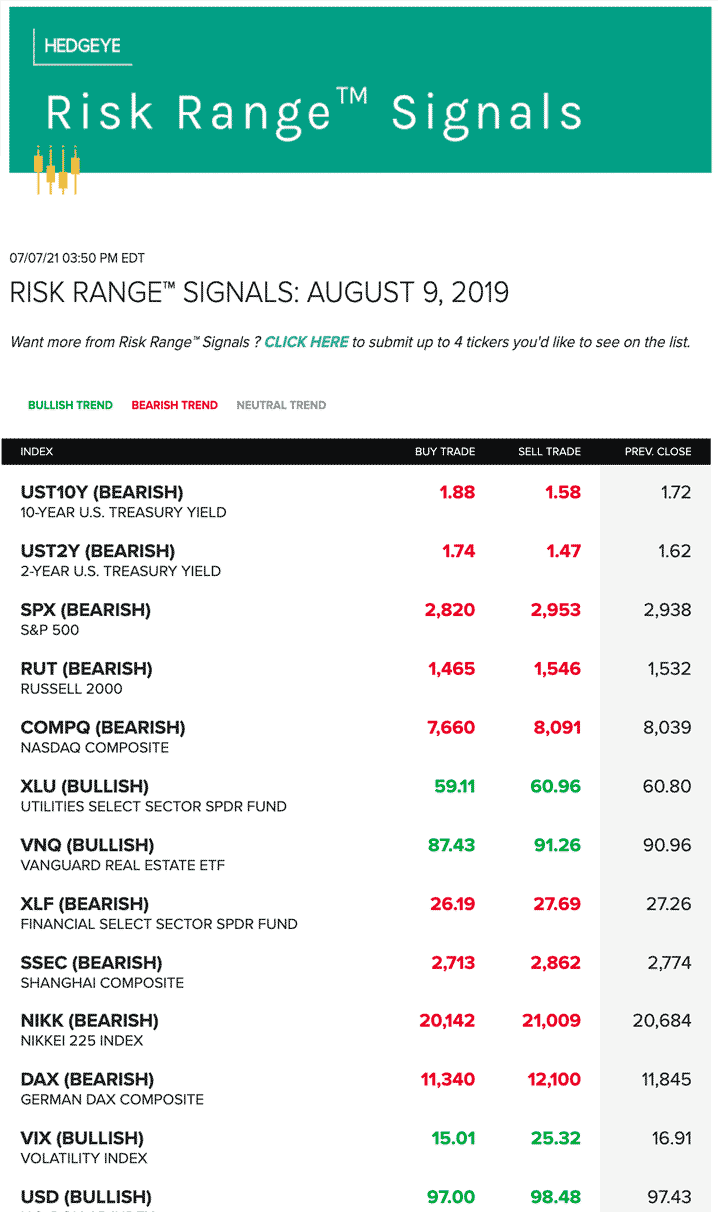
Each day before the market opens, you receive buy and sell levels on major equity and bond markets, commodities and currencies, including:
Top 15 Tickers
Updated ranges on key tickers-everything from the S&P 500 and VIX to Gold, Oil and the Nikkei. (Click here for the full coverage list.)
The Wild Cards
A refreshed update of tickers looming largest on our radar screen or submitted by our subscribers (from FAANG stocks to Tesla).
Multi-Duration
Our immediate-term levels (Trade) for 20 tickers in addition to Keith's intermediate-term view (Trend), be it bullish, bearish or neutral.
Bottom line is Risk Range™ Signals helps you make better sales at the top end of the range and better purchases at the low end.
If you have any questions whatsoever, please do not hesitate to email us at
support@hedgeye.com.
We look forward to working together!
Watch the video introduction:
About Hedgeye
Hedgeye Risk Management is an independent investment research and online
financial media company. Focused exclusively on generating and delivering
thoughtful investment ideas in a proven buy-side process, the firm combines
quantitative, bottom-up and macro analysis with an emphasis on timing. The
Hedgeye team features some of the most highly-regarded research analysts on
Wall Street, all with buy-side experience, covering Macro, Financials, Energy,
Healthcare, Retail, Gaming, Lodging & Leisure (GLL), Restaurants, Industrials,
Consumer Staples, Communications, Cannabis, Housing, Materials, Technology,
Demography and Washington policy analysis.
Risk Range™ Signals
User Guide
Improving Your Market Timing
Markets are (often) driven by irrational human behavior. Behavioral psychologists have taught market practitioners a lot about the emotional nature of financial markets. Concepts like confirmation bias, loss aversion and herding have entered the investing lexicon. Here at Hedgeye, we’ve incorporated these concepts into our risk management process.
That’s where our emotionless quantitative Risk Range™ Signals model comes in.
Developed by CEO Keith McCullough during his years as a hedge fund manager, it is specifically designed to risk manage the reflexive nature of markets.
In other words, it removes the emotion.
Why does this matter?
The proliferation of theesee risk management policies has made financial markets more sensitive then ever to rapid changes in financial market volatility. For the record, JPMorgan estimates that systematic trading accounts for ver 90% of US equity trading volume. Furthermore, BlackRock anticipatees ETF/TEP AUM will double to 12$ trillion over the next 5 years.
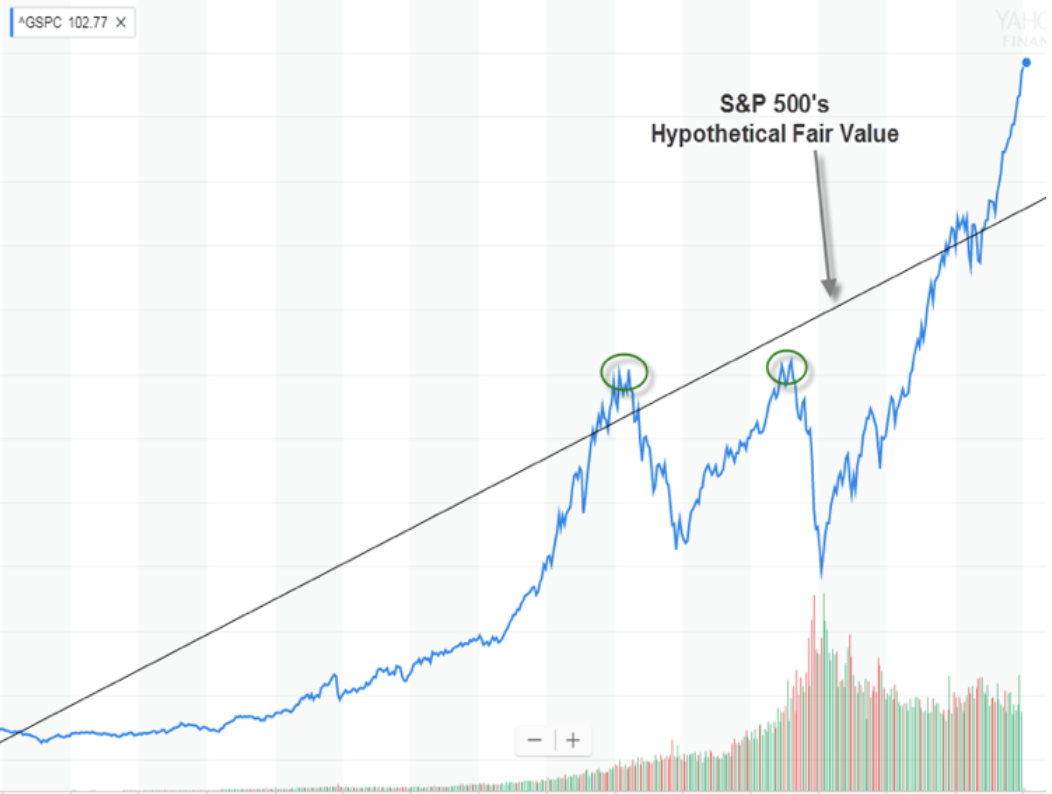
Question: How useful was it for you to know that the S&P 500’s long-term “fair value” was significantly higher than its actual price, after the index rolled off its peaks in 2000 and 2007 (circled in green)?
Back then, the Great Recession caused panic in financial markets. From peak to trough, the S&P 500 dropped over -40%. In other words, an investor with “inopportune” market timing would have gone broke multiple times waiting for the S&P 500 to recoup its supposed “fair value.”
Of course, most trading days are not so obviously fraught with emotion. Still, market dislocations (however small) do happen daily. It’s a savvy investor’s job to put aside the emotion and identify those risks and opportunities.
There’s a solution...
Our quantitative risk range model was designed to incorporate these “reflexive” and behavioral element of financial markets. Reflecting the uncertainty embedded in financial markets, these immediate-term Risk Range™ Signals are dynamic.
In other words, the immediate-term Risk Range™ Signals change as the data changes.
The model uses three core inputs – price, volume and volatility – to determine the likely daily trading range for any publically-traded asset class.
To break it down conceptually, if an asset's price and volume are rising while its volatility is falling, that's bullish. It means investors are buying with conviction. In this scenario, an asset's Risk Range generally narrows as the probable outcome of that asset heading higher goes up.
On the other hand, if an asset's price is falling, while volume and volatility are rising, that's bearish. It means investors are selling with conviction. In this scenario, an asset's Risk Range generally widens as the probable outcome of that asset heading lower goes up.
It is an overly simplistic explanation but conceptually sound.
At its core, our Risk Range™ Signals model is designed to be intuitive: You sell at the top end of the range and you buy at the low end.
Risk Range™ Signals
User Guide
Investing Across Different Durations
Every investor has different needs.
You may manage a handful of different “portfolios,” be they retirement accounts, trusts or 529 college savings plans. Each of these could be invested with different time horizons in mind or segmented based on your liquidity needs.
We understand.
Our goal at Hedgeye is to provide you with the sharpest research tools on Wall Street each of which conforms to your many research needs.
Risk Range™ Signals: A Critical Risk Management Tool
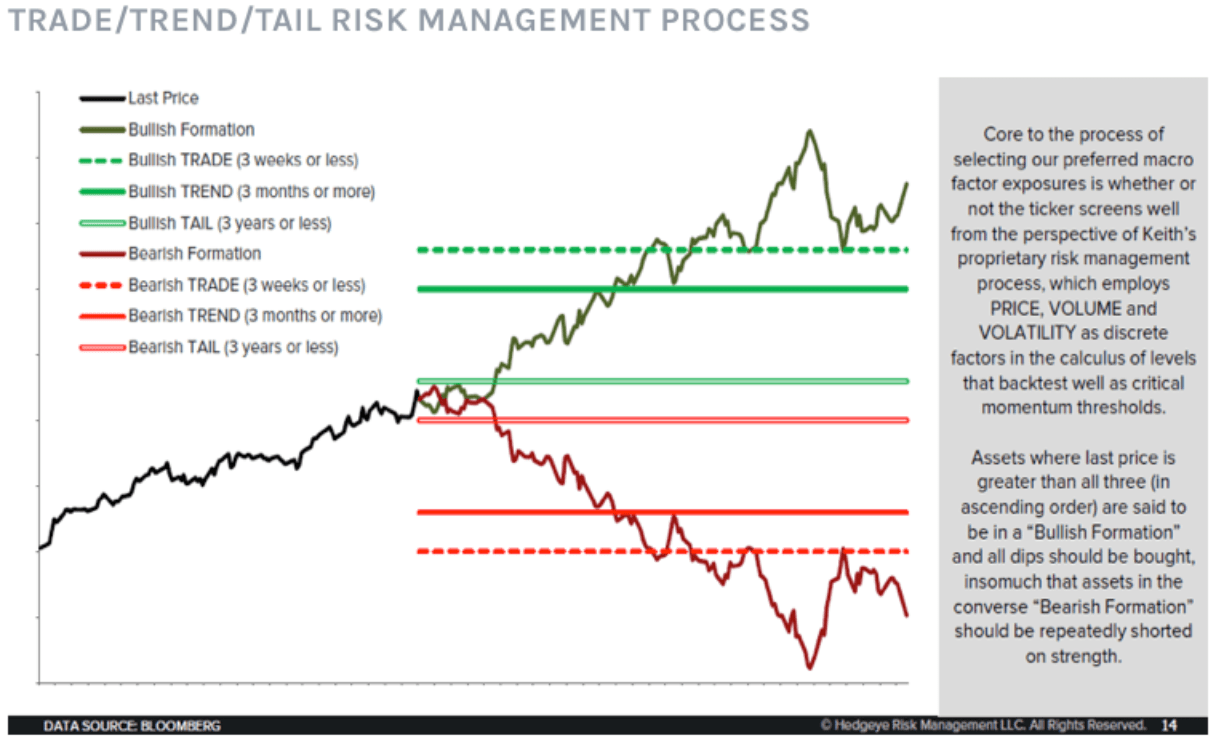
Hedgeye CEO Keith McCullough’s quantitative Risk Range model was designed specifically to be multi-duration. This means our Risk Range™ Signals dynamically adjust to suggest critical thresholds – over short-term (TRADE), medium-term (TREND) and long-term (TAIL) durations – after which, upon breaching these levels, an asset flips from bullish to bearish or vice versa.
The idea is to give investors a clear framework for understanding how an asset is trading over short-term, medium-term, and long-term time horizons. Using our Risk Range™ Signals as your guide, from there, an investor can determine for themselves what level of volatility they are comfortable with stomaching.
These Risk Range™ Signals are also dynamic across these durations, meaning the ranges change as the data changes, to incorporate the reflexive, ever-changing nature of markets. (Behavioral psychology matters… Don’t let PhD economists tell you irrational human behavior doesn’t impact financial markets!)
Here’s a brief tutorial for understanding the duration component of our Risk Range™ Signals.
How to Interpret Bullish and Bearish Trends
So, what to do when an asset is in a bullish formation and it corrects to the low-end of its immediate-term “Trade” Risk Range?
“When a bull market corrects, you should be buying the damn dip, not selling it,” says CEO Keith McCullough. In other words, when an asset is in a "Bullish Formation” – again meaning the asset’s price is above the critical “Trend” and “Tail” Risk Range thresholds – you use the immediate-term “Trade” ranges to risk manage the daily moves of that asset.
But hang on.
This is an important point about our TREND and TAIL ranges. If an asset was bullish but fell and were to breach either the Trend line or both TREND and TAIL levels, it would signal a major shift in sentiment and momentum from bullish to bearish (according to the model’s measurement of price, volume and volatility). This is called a bullish to bearish “phase transition.”
Make no mistake, when an asset dances around its Trend line, we’re monitoring it closely for confirmation that it either maintains its Trend or we see a sustained breakdown confirmed by the asset’s price, volume and volatility.
When an asset confirms a Trend breakdown, you get out!
Bottom Line
A lot of Wall Street-types wake up in the morning and try to tell Mr. Market what they think it should be doing. Our Risk Range process is designed to measure and map what the Market is actually doing. This provides investors with a repeatable risk management process which complements our rigorous fundamental research views.
Risk Range™ Signals
User Guide
Hedgeye's Macro Playbook
Our goal is to give you a foundational understanding —start to
finish—of the basics of how we analyze financial markets and
identify compelling risks and opportunities. We believe it will
amplify your use of all of our investing research products and
tools.
This Macro Playbook explains our quantitative models – like our
proprietary risk ranges and GDP predictive tracking algorithm – as
well as how we select our top investing ideas (stocks, bonds or ETFs).
Our repeatable research process has been carefully crafted and
refined throughout our decade in the independent research business.
Armed with this framework, we are confident you will make better
investing decisions.
Click here
to read our Macro Playbook
Risk Range™ Signals
User Guide
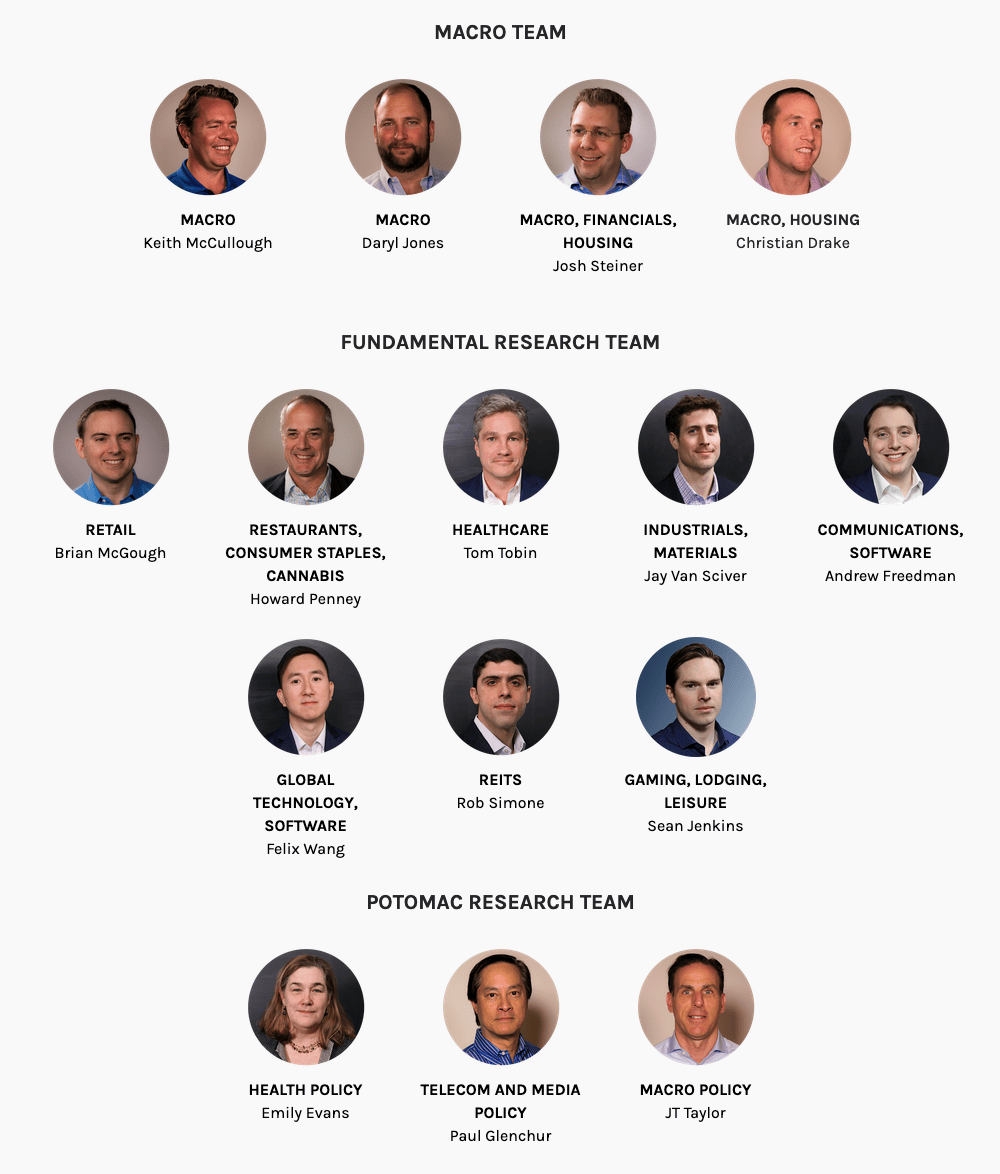
Meet Our Research Team
We are obsessed with delivering superior investment ideas. You likely
know this by now.
Our hybrid investing approach combines:
- 1. proprietary quantitative analysis
- 2. bottom-up sector research
- 3. top-down macro research with an emphasis on duration.
The end result is an intelligent, high-octane suite of products that
draws on insights from over 40 research analysts. We cover everything
from Global Macro and Retail, to Energy, Restaurants and Washington
Policy research.
Our unique research team at Hedgeye is composed of some of the
most highly-regarded analysts in the industry. Our quantitative
models and fundamental research teams complement one another.
Here’s how.
1. QUANTITATIVE RISK RANGES
Our quantitative Risk Range model was developed by CEO Keith McCullough
during his years as a hedge fund manager.
This Risk Range model is utilized throughout the entire suite of
Hedgeye research products to augment our 40+ person research team’s
fundamental views. Think about it. All investors have some basket of
core investing ideas (stocks, bonds, ETFs or all of the above).
Identifying those investing ideas is tough enough, then you have to
deal with the uncertainty of markets.
When CEO Keith McCullough built his proprietary Risk Range model the
aim was simple: Create a quantitative risk management tool to help
investors actually
buy low and sell high.
The model uses three core inputs – price, volume and volatility – to
determine the likely daily trading range for any publicly-traded asset
class. These risk ranges are dynamic. They change as the data changes.
At its core, you sell at the top end of the range, and buy at the
low end.
Our team of 40+ fundamental research analysts pride themselves on
identifying non-consensus investing ideas. We understand that the
path from non-consensus investing idea to top-performer is far from
linear. The ultimate aim of our Risk Ranges model is to help investors
risk manage our analyst’s favorite investing ideas.
2. BOTTOM-UP SECTOR RESEARCH
Our investment research team is headquartered in Stamford, Connecticut.
It is made up of research analysts with buy-side and sell-side
experience. Our policy research team in Washington D.C. is composed
of seasoned veterans with many decades of experience. They possess
high-level experience and contacts having worked in a variety of
influential positions over the years.
Our goal is simple. Since “Day One” more than ten years ago, our
focus has been to build the most thoughtful and thorough team on Wall
Street. We seek to translate our unique, combined knowledge into
successful investment opportunities for all of our subscribers—big
and small.
Our collective investment experience includes time at Carlyle
Blue-Wave, Ardsley Partners, Buckingham Research, Morgan Stanley,
Dawson-Herman Capital, Wells Fargo Securities, to name a few, while
our combined policy experience includes time at the U.S. Court of
Appeals, U.S. Energy Department, U.S. Office of Defense, U.S. Federal
Reserve, U.S. Chamber of Commerce, and more.
3. TOP-DOWN MACRO RESEARCH
In addition to a deep bench of 19 fundamental equity and Washington
policy research teams, our Macro team measures and maps economic data
for the top 50 economies around the world, covering 90% of global GDP.
We run predictive tracking algorithms for both growth and inflation
for each of these economies to forecast the likely path for financial
markets.
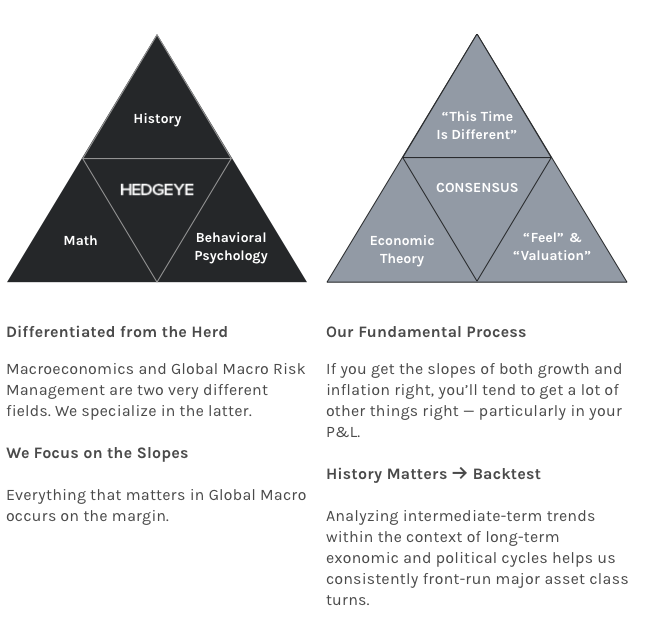
Bottom Line: Our Macro team is focused on generating investable ideas
based on this research that combines their deep study of market
history, the tracking of Wall Street consensus positioning and the
volatility signals embedded in futures and options markets.
(We encourage you to dig deeper by reading our
“Macro Playbook.”
)
The combined knowledge of 1) proprietary quantitative analysis 2)
bottom-up sector research 3) top-down macro research makes your
Hedgeye subscription the best bang-for-your-investing-research-buck
out there.