HEDGEYE
Market Edges
User Guide
Dear Market Edges subscriber,
Identifying attractive investment opportunities around the world and across asset classes is a full-time job. We have over 40 research analysts closely tracking markets and economies around the globe so you don’t have to. With Market Edges, you receive our thoughtful investing research distilled into one tidy, easy-to-digest weekly newsletter.
Think of it as your weekly risk management guidebook.
Getting Started: How To Use Market Edges
How It Works
Market Edges is a weekly investing newsletter that analyzes the week’s most important global economic developments. It crystallizes these developments into investable, big picture macro trends for which you and your clients need to be positioned.
Each edition features our detailed analysis of the prior week’s economic and market developments. In other words, this essential big picture market intelligence keeps you a step ahead of Wall Street consensus.
What You Get With Market Edges
Market Edges is broken into six distinct sections. We distill the most important macroeconomic developments and identify compelling investing opportunities and risks across the spectrum.
Here’s the breakdown:
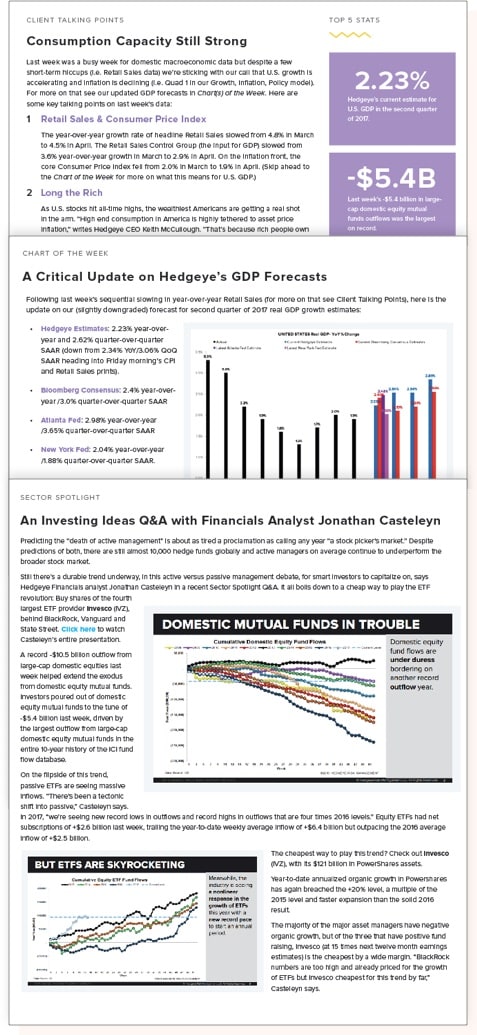
Client Talking Points
This is what you (or perhaps your clients) need to know about the prior week. We segment key financial market developments into three concise, but essential bullets.
Chart of the Week
The global zeitgeist captured in one definitive chart. Our Chart of the Week cuts through the noise and highlights what most investors miss with additional insight.
Sector Spotlight
We highlight market analysis from one of our 12 equity Sector Heads who provide the latest intelligence on what’s happening inside sub-sectors of the U.S. stock market, from Retail to Energy, while highlighting some favorite stock ideas.
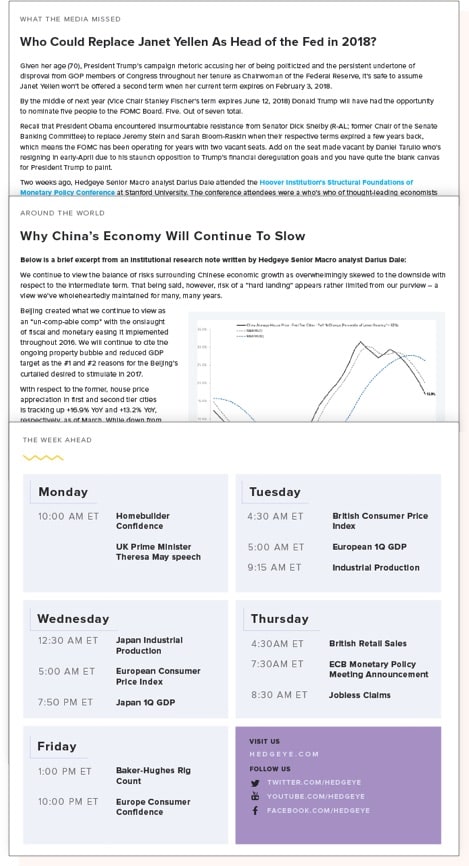
What the Media Missed
There’s a lot of misinformation out there. By undressing a recent mainstream media market myth we reveal a deeper, market-moving truth.
Around the World
Some of the market trends we’re thinking most deeply about. This go-anywhere segment features insights from our Macro team’s global research – like our latest take on Europe, China or Japan.
The Week Ahead
What to watch. These are the dates and times of important catalysts and key economic data releases to keep a close eye on in the coming week.
Market Edges is designed to answer one fundamental question: What are the big picture macro developments you need to get ahead of to prepare yourself for what comes next?
If you have any questions whatsoever, please do not hesitate to email us at
support@hedgeye.com.
We look forward to working together!
About Hedgeye
Hedgeye Risk Management is an independent investment research and online
financial media company. Focused exclusively on generating and delivering
thoughtful investment ideas in a proven buy-side process, the firm combines
quantitative, bottom-up and macro analysis with an emphasis on timing. The
Hedgeye team features some of the most highly-regarded research analysts on
Wall Street, all with buy-side experience, covering Macro, Financials, Energy,
Healthcare, Retail, Gaming, Lodging & Leisure (GLL), Restaurants, Industrials,
Consumer Staples, Communications, Cannabis, Housing, Materials, Technology,
Demography and Washington policy analysis.
Market Edges
User Guide
Investing Using Hedgeye Macro Themes
Just months before the onset of the 2008 financial crisis, Hedgeye warned subscribers the stock market top was in. Back then, Hedgeye CEO Keith McCullough recommended subscribers book gains, raise cash, wait and watch.
Risk management is ingrained in our DNA.
Market Edges is your weekly investing update on big picture macro trends driving markets. It is backstopped by our Macro research team’s Quarterly Investment Outlook. This market outlook is the bedrock upon which smart investing decisions are made.
Each quarter, we publish our quarterly investment themes. These are the three, big “top-down” catalysts our proprietary models suggest are likely to drive investment returns over the months to come. Our economic forecasts are bolstered by proprietary sentiment indicators suggesting what investors are not yet positioned for.
Whether these themes are #ChinaSlowing, #EuropeSlowing or USA #Peak Cycle, our Macro team has had an excellent run identifying various investable pivots in growth, inflation and policy – both domestically and internationally.
Let’s dig deeper.
How We Arrive At Our Quarterly Macro Themes
Our Macro team monitors global economic and market data for the largest 50 countries around the globe.
1. We produce growth and inflation forecasts for each of those countries;
2. We have a proprietary quantitative Risk Range model supporting our fundamental research to help identify “bullish” and “bearish” trends in asset markets;
3. We track Wall Street consensus positioning (using CFTC data); and
4. We monitor forward-looking volatility expectations (gleaned from the derivatives market).
All of this data is measured and mapped daily. At the beginning of each quarter we select the three essential Macro themes we believe will drive market returns in the coming months.
Each of these four components is essential in building a rigorous research mosaic from which we derive our investment conclusions. Below are 3 important videos explaining each of these components of our research process.
Understanding How We Model the U.S. Economy
Our Growth, Inflation, Policy (GIP) model is “is one of the hallmarks of our
fundamental research process,” in the video below. Due to popular demand for a primer on the
topic, we’ve produced a special video.
The key question: Is growth and inflation heating up or cooling down?
From there, we get four possible outcomes. Each is assigned a “quadrant”
in our Growth, Inflation, Policy (GIP) model along with the typical
government response as a result (neutral, hawkish, in-a-box or dovish):
Growth accelerating, Inflation slowing (QUAD 1); Growth accelerating,
Inflation accelerating (QUAD 2); Growth slowing, Inflation accelerating
(QUAD 3); Growth slowing, Inflation slowing (QUAD 4).
If you know the answers to both of those questions you can select
investments based on what works in each of the Quads. “In QUAD 1, for
instance, where growth is accelerating and inflation is slowing, that
has historically been really positive for both equity and credit data
across all sectors of the U.S. economy,”
“Whereas when you think about QUAD 4, in which growth and inflation
are slowing concomitantly, that has historically actually been quite
negative for both equities and credit.”
Understanding Wall Street Positioning & How to Track It
Just as important as vetting the fundamentals of any investing idea is
knowing the investment community’s positioning around that idea.
Namely, is this a consensus or contrarian trade? It’s another essential
tool in your investing toolkit since, if Wall Street is too bullish or
bearish, you may have already missed the move.
At Hedgeye, we measure and map the CFTC’s Commitments of Traders report,
across asset classes, to learn precisely that: What does current
investor consensus positioning look like and where can we add the most
value with a non-consensus market call?
Understanding How to Interpret Volatility
Understanding volatility is another essential tool in your macro
toolkit. At Hedgeye, we have a nuanced view about how to incorporate
this measure into your portfolio decision-making process.
“Core to our risk management overlay here at Hedgeye is using not
only the price, but also volume and volatility as
indicators of a security’s immediate-term price range.
In other words, we use volatility to get an edge on consensus in
predicting the highest probability outcome for future asset prices.
Market Edges
User Guide
Use Hedgeye for Asset Allocation
Like a weatherman measuring changes in barometric pressure to predict evolving weather patterns... what if you could more accurately forecast future market returns?
Think of financial markets as the weather, and your asset allocation as the clothes you wear. An intelligent portfolio constructed around what the market is going to do in the future is like knowing it’s supposed to rain today and grabbing your umbrella.
In both portfolio construction and weather-related attire, nobody likes surprises.
Our Growth, Inflation, Policy (GIP) model is “the hallmark of our fundamental resear
ch process. This model is based on our back-testing of historical financial market data which shows the year-over-year rate of change of growth and inflation are the most consequential factors to track for predicting future financial market return.
The GIP model is a critical tool for making asset allocation decisions. This regime-based framework separates the rate of change in growth and inflation into four quadrants:
• Growth accelerating, Inflation slowing (QUAD 1);
• Growth accelerating, Inflation accelerating (QUAD 2);
• Growth slowing, Inflation accelerating (QUAD 3);
• Growth slowing, Inflation slowing (QUAD 4)
After building this base of knowledge, we help investors make asset allocation selections based on our historical back-testing of the different asset classes that perform best in each of the four quadrants.
The results of those back-tests – across all asset classes from equities to bonds to currencies and commodities – are below:
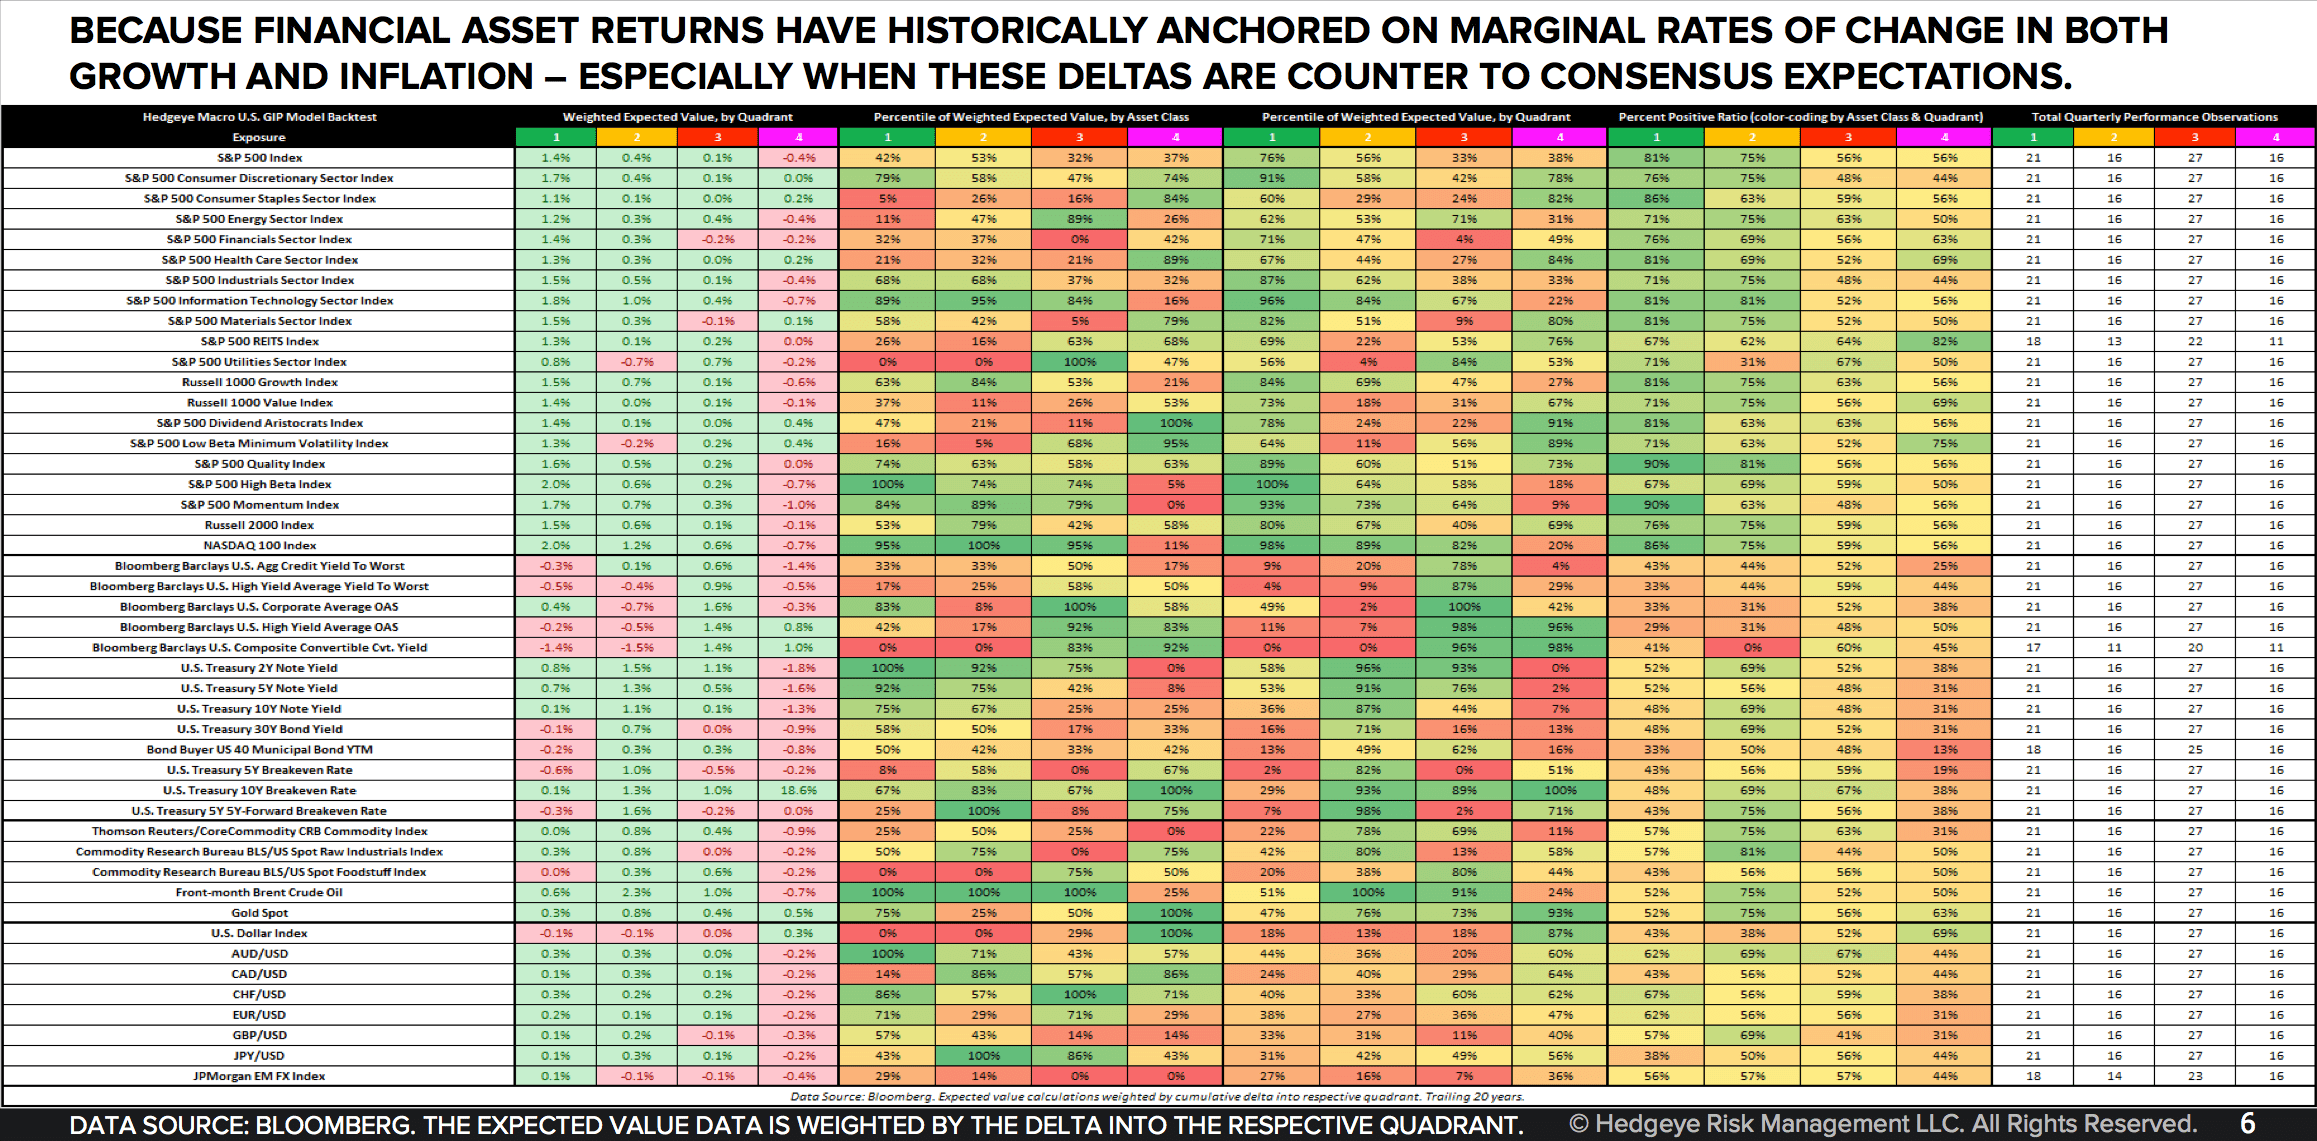
We’ve also simplified the output of those results in the chart below identifying the broad sector and style factors that outperform and underperform in each of the Quads.

In QUAD 1, for instance, where growth is accelerating and inflation is slowing, that has historically been really positive for both equity and credit data across all sectors of the U.S. economy.
In this quadrant, the top U.S. equity sector overweights are Tech (XLK), Consumer Discretionary (XLY) and Industrials (XLI). The top underweights are Utilities (XLU), Consumer Staples (XLP) and Energy (XLE). From a style factor perspective, long Momentum, High Beta and Growth stocks work best in Quad 1.
Meanwhile, when you look at QUAD 4, in which growth and inflation are slowing at the same time, that has historically been quite negative for both equities and credit with the sector overweights and underweights almost exactly opposite.
The overweights in Quad 4 include Healthcare (XLV), Consumer Staples (XLP) and REITs (VNQ). The top underweights are Tech (XLK), Energy (XLE) and Industrials (XLI). From a style factor perspective, long High Dividend Yield, Low Beta, Minimum Volatility and Quality stocks work best in Quad 4.
Now, within each of the quadrants, there’s risk to be managed day-to-day. We fundamentally believe that there’s no set-it-and-forget-it portfolio that weathers every financial market storm. So, while our GIP model is an excellent starting point, we have a number of risk management overlays to help you optimize portfolio decision making.
• Our GIP model is run for the top 50 economies around the globe to identify investable pivots worldwide.
• Our quantitative Risk Range model helps investors capture “behavioral alpha,” basically this quantitatively measures the price, volume and volatility of all publicly-traded asset classes to identify “bullish” and “bearish” market trends.
• We measure and map the changes in Wall Street consensus positioning using CFTC “Commitments of Traders” report and underlying Volatility data embedded in futures and options markets.
All of this Macro intelligence is used to identify the most important investable risks and opportunities. It helps investors optimize asset allocations based on their own liquidity needs and time preferences.
In Market Edges, you get all of these “big picture” insights delivered directly to your inbox every week.
Market Edges
User Guide
Hedgeye's Macro Playbook
Our goal is to give you a foundational understanding —start to
finish—of the basics of how we analyze financial markets and
identify compelling risks and opportunities. We believe it will
amplify your use of all of our investing research products and
tools.
This Macro Playbook explains our quantitative models – like our
proprietary risk ranges and GDP predictive tracking algorithm – as
well as how we select our top investing ideas (stocks, bonds or ETFs).
Our repeatable research process has been carefully crafted and
refined throughout our decade in the independent research business.
Armed with this framework, we are confident you will make better
investing decisions.
Click here
to read our Macro Playbook
Market Edges
User Guide
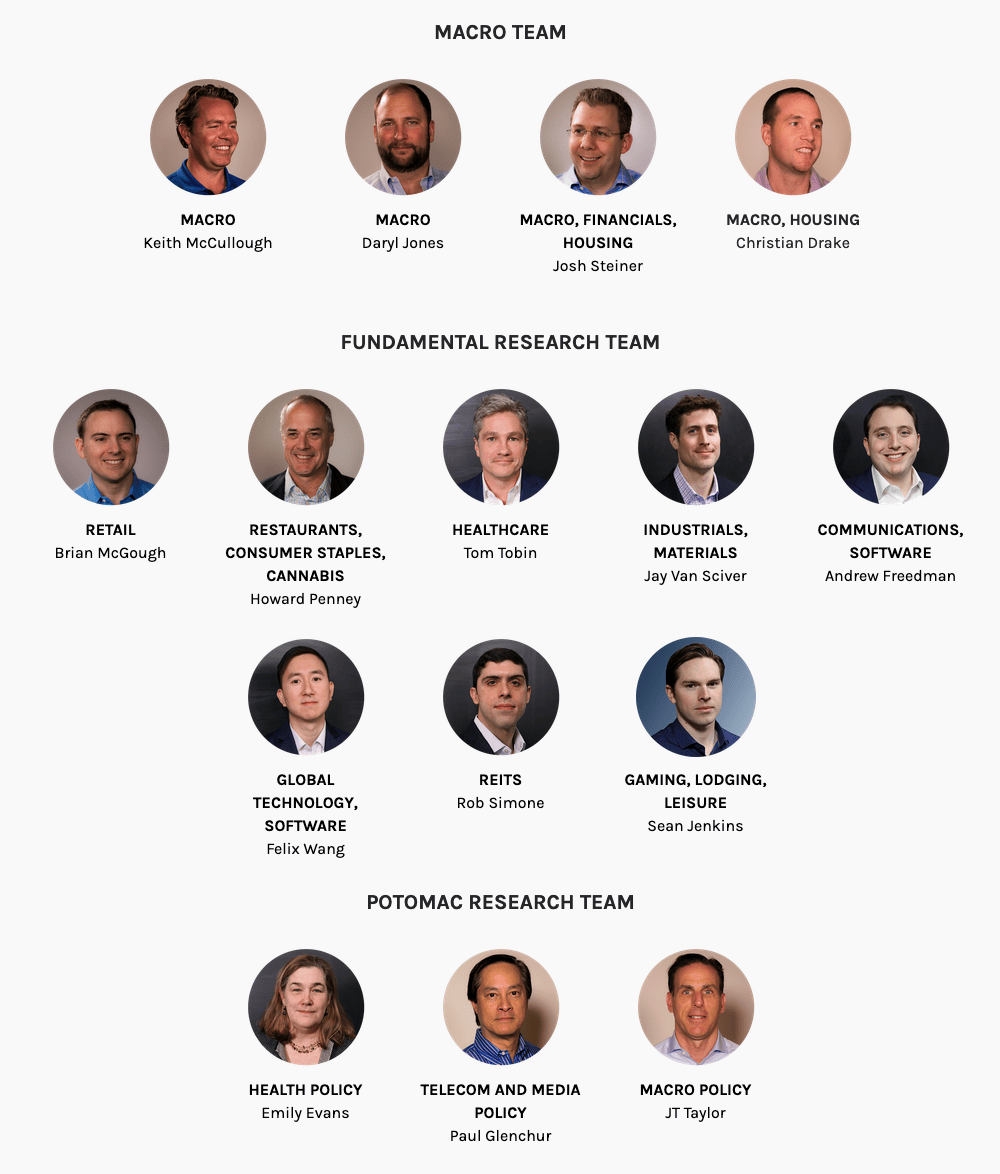
Meet Our Research Team
We are obsessed with delivering superior investment ideas. You likely
know this by now.
Our hybrid investing approach combines:
- 1. proprietary quantitative analysis
- 2. bottom-up sector research
- 3. top-down macro research with an emphasis on duration.
The end result is an intelligent, high-octane suite of products that
draws on insights from over 40 research analysts. We cover everything
from Global Macro and Retail, to Energy, Restaurants and Washington
Policy research.
Our unique research team at Hedgeye is composed of some of the
most highly-regarded analysts in the industry. Our quantitative
models and fundamental research teams complement one another.
Here’s how.
1. QUANTITATIVE RISK RANGES
Our quantitative Risk Range model was developed by CEO Keith McCullough
during his years as a hedge fund manager.
This Risk Range model is utilized throughout the entire suite of
Hedgeye research products to augment our 40+ person research team’s
fundamental views. Think about it. All investors have some basket of
core investing ideas (stocks, bonds, ETFs or all of the above).
Identifying those investing ideas is tough enough, then you have to
deal with the uncertainty of markets.
When CEO Keith McCullough built his proprietary Risk Range model the
aim was simple: Create a quantitative risk management tool to help
investors actually
buy low and sell high.
The model uses three core inputs – price, volume and volatility – to
determine the likely daily trading range for any publicly-traded asset
class. These risk ranges are dynamic. They change as the data changes.
At its core, you sell at the top end of the range, and buy at the
low end.
Our team of 40+ fundamental research analysts pride themselves on
identifying non-consensus investing ideas. We understand that the
path from non-consensus investing idea to top-performer is far from
linear. The ultimate aim of our Risk Ranges model is to help investors
risk manage our analyst’s favorite investing ideas.
2. BOTTOM-UP SECTOR RESEARCH
Our investment research team is headquartered in Stamford, Connecticut.
It is made up of research analysts with buy-side and sell-side
experience. Our policy research team in Washington D.C. is composed
of seasoned veterans with many decades of experience. They possess
high-level experience and contacts having worked in a variety of
influential positions over the years.
Our goal is simple. Since “Day One” more than ten years ago, our
focus has been to build the most thoughtful and thorough team on Wall
Street. We seek to translate our unique, combined knowledge into
successful investment opportunities for all of our subscribers—big
and small.
Our collective investment experience includes time at Carlyle
Blue-Wave, Ardsley Partners, Buckingham Research, Morgan Stanley,
Dawson-Herman Capital, Wells Fargo Securities, to name a few, while
our combined policy experience includes time at the U.S. Court of
Appeals, U.S. Energy Department, U.S. Office of Defense, U.S. Federal
Reserve, U.S. Chamber of Commerce, and more.
3. TOP-DOWN MACRO RESEARCH
In addition to a deep bench of 19 fundamental equity and Washington
policy research teams, our Macro team measures and maps economic data
for the top 50 economies around the world, covering 90% of global GDP.
We run predictive tracking algorithms for both growth and inflation
for each of these economies to forecast the likely path for financial
markets.
Bottom Line: Our Macro team is focused on generating investable ideas
based on this research that combines their deep study of market
history, the tracking of Wall Street consensus positioning and the
volatility signals embedded in futures and options markets.
(We encourage you to dig deeper by reading our
“Macro Playbook.”
)
The combined knowledge of 1) proprietary quantitative analysis 2)
bottom-up sector research 3) top-down macro research makes your
Hedgeye subscription the best bang-for-your-investing-research-buck
out there.