Flush with stimulus cash and enhanced jobless benefit inflows and facing an acute lack of services consumption opportunities (restaurant capacity reduction, travel restrictions, associated spending on leisure activities, etc.) conditions have cultivated a redirection deluge resulting in a boon to the savings rate & goods consumption (i.e. retail sales) as services spending has continue to languish, both absolute and relative.
The related analytical exercise has been relatively straightforward:
- Monitor for marginal changes as the main thrust of mechanical rebound/deferred consumption associated with reopening efforts begins to ebb.
- Similarly, monitor for marginal changes as the residual benefit of stimulus payments rolling off, the impending expiration of various forbearance programs pulls closer on the timeline and 2nd wave layoff risk rises amidst PPP fund exhaustion and still depressed demand. In effect, the collective income cliffs and all their attendant implications and prospective network effects.
- Monitoring for compositional changes in consumption (goods vs services … you can only buy so many computer monitors and office chairs) and any drawdown in the spike in money supply as evidence that consumption appetite is returning on the part of consumers and lending/investing appetite is emerging on the business/lending side.
Again, as we’ve highlighted, the growth recovery will be defined by a recovery in underlying, organic consumption capacity with the labor/income recovery needing to occur faster than support goes away – a precarious tightrope walk necessitating further policy support if a durable recovery in our instant gratification, retail therapy-centric economy is to be realized.
With respect to this morning’s data specifically, it’s somewhat mixed:
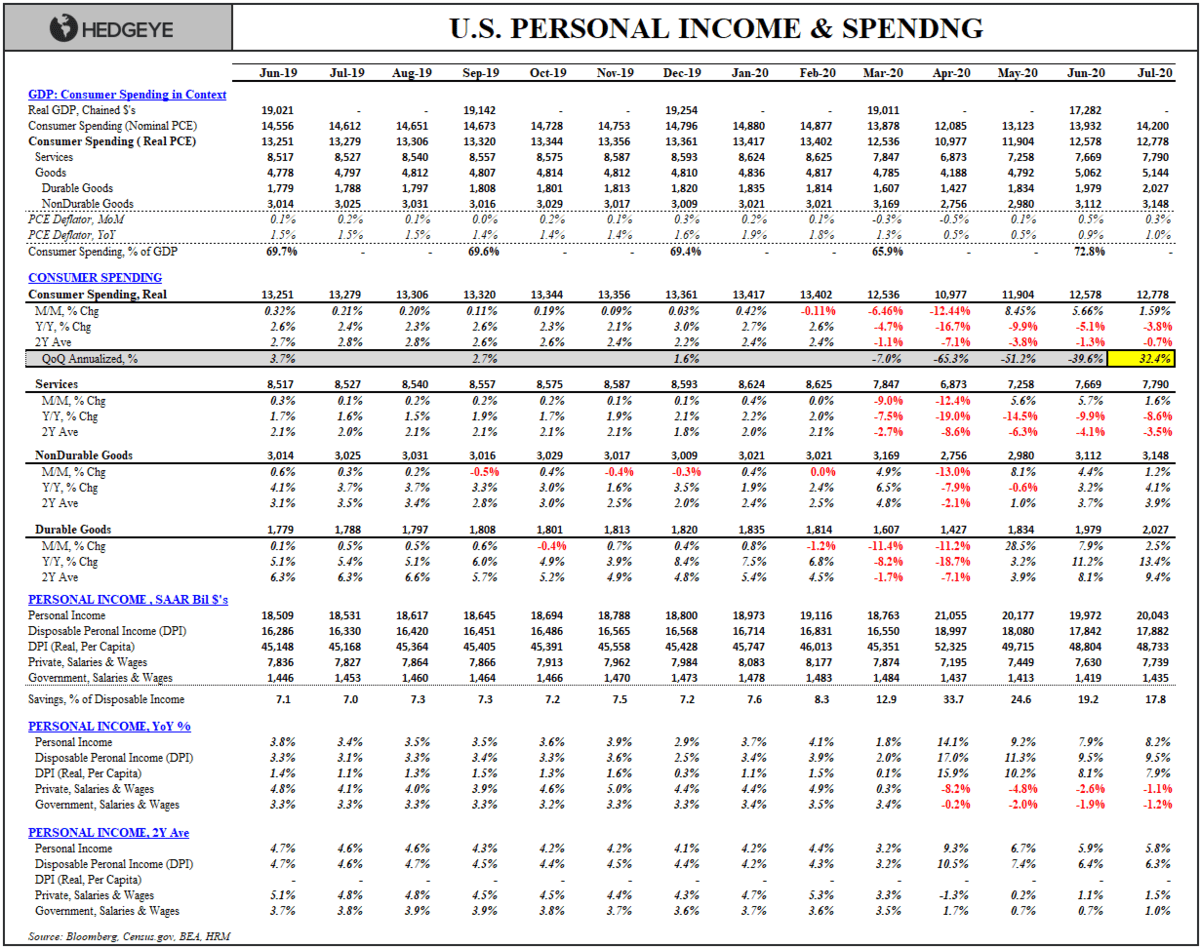
- Both the consumption and income recoveries continue to show incremental improvement as the saving rate continues to fall and alongside net positive payroll growth. Indeed, sequential (annualized) growth in the quarter is tracking +32.4% Q/Q.
- However, Consumption growth remains down -3.8% Y/Y with Services Consumption (roughly 2/3 of household spending) down -8.6% Y/Y with improvement slowing.
- Moreover, the July data only partially captures the impact of paused re-openings and reinstitution of large-scale containment initiatives.
- Initial Claims remain stubbornly stalled, payroll progress remains muted for what should be the steepest part of the recovery curve and the risks to the consumption outlook associated with the various income cliffs highlighted above have yet to really play out.
Oh … and while the 30M people without enough food to eat shift to a new average “eating stuff” targeting framework, rich people continue to "pleasure" in the perks of socialism for the elite as they monitor ATH’s in equity benchmarks from their boat and/or plane, apparently (1st chart below) ….