
TREND WATCH: What’s Happening? For the last several years, health experts have been fretting over America's declining life expectancy. In 2014 U.S. life expectancy reached an all-time high of 78.9 years. Since then, CDC data have shown a decline every year through 2017. The ongoing decline has prompted a great deal of media gloom about the fundamental health (physical and emotional) of the American people.
Our Take: Last fall, we predicted that U.S. life expectancy would again begin to rise in 2018. The official statistics just released by the CDC have proven us correct. Life expectancy rose by 0.1 years to 78.7 years in 2018. Major drivers behind this rise included a large decline in cancer mortality and the first decline in many years in drug overdose fatalities. By age, seniors and (Millennial) young adults showed the most improvement. Midlife adults (mostly Xers) showed the least improvement. Though the overall news is positive, there is little cause for celebration. The 2018 life-expectancy rise was quite modest, and the 2010s are still likely to be become the first flat decade in life expectancy since the beginning of the 20th century.
u.s. life EXPECTANCY increases for first time in four years
You heard it here first. We have been looking at quarterly CDC data, and as of last fall we predicted that life expectancy would rise (and age-adjusted mortality would fall) in 2018. (See “Fentanyl Takes Title of Deadliest Drug” and “Death Becomes Us...Mortality Increases.”) The CDC has now officially confirmed our prediction in its new report, "Mortality in the United States, 2018."
So what exactly did the report say? For the total population, life expectancy rose by 0.1 years--from 78.6 years in 2017 to 78.7 years in 2018. Men and women gained equally. Also, the latest quarterly data suggest we will see another improvement in 2019.
But let me emphasize: The improvement we are seeing is only marginal. The 2018 figure (78.7) is still below the life expectancy numbers for 2012, 2013, and 2014. And it's basically back to where we were in 2010 and 2011. So it remains true that the 2010s are likely to end up as the first utterly flat decade in U.S. life expectancy at birth since the U.S. Federal Health Service first began compiling accurate vital statistics back in 1900.
Age-adjusted mortality rates also rebounded, from 731.9 per 100,000 in 2017 to 732.6 in 2018. The latter figure is (barely) the lowest ever. But we should avoid any self-congratulation here. Life expectancy is the more meaningful indicator. Age-adjusted mortality looks better only because mortality rates over age 65 have been declining faster than mortality rates under age 65--and declines among seniors don't add as much to life expectancy.


Opioid deaths down while suicide up
Among the top ten leading causes of death, mortality rates in 2018 were down for eight and were up for two. In only one was the mortality rate up significantly, and that's suicide (+1.4% in 2018). Three were down significantly: unintentional injuries (- 2.8%); cancer (-2.2%); and heart disease (-0.8%). If you've been an avid NewsWire reader, you can probably guess the story behind each of these. But let's take a closer look.

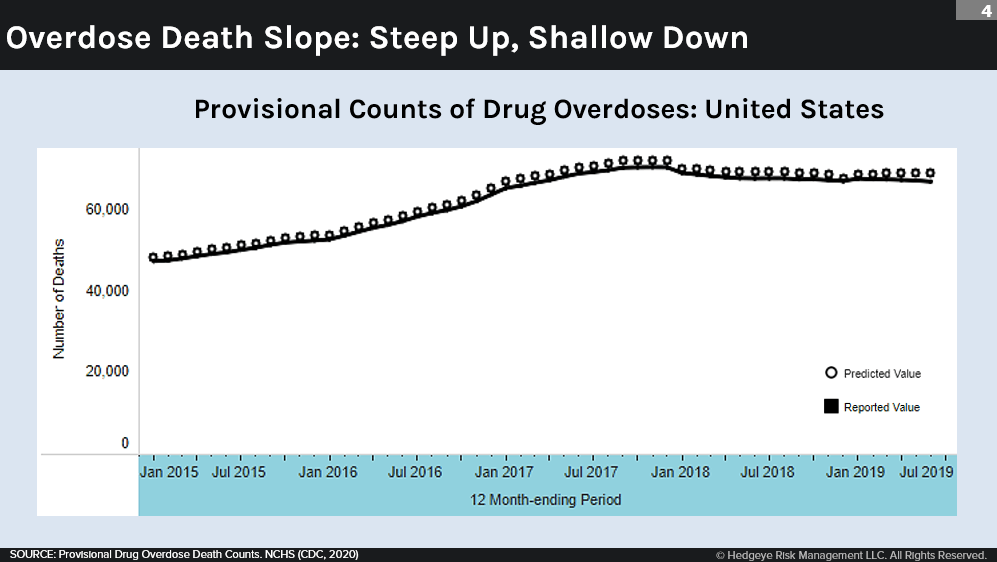
Suicide was the one significant bad-news signal in the 2018 data, and we certainly have been following this story. (See "America's Suicide Rate: Up One-Third Since 1999.") On "unintentional injuries," that category is dominated by traffic fatalities and drug overdoses. Per-capita traffic fatalities, after a brief upward surge from 2011 to 2016, are now trending down again. Meanwhile, the decline in drug overdose deaths is a big story. The data show that drug overdose death rates peaked in late 2017 or early 2018 and began to fall throughout the rest of the year, (See “Overdose Mortality Falling, But Fentanyl Deaths Still Rising”). With a government crackdown on physicians and costly lawsuits against Big Pharma, prescription deaths peaked in the spring of 2017. And now, with mobilized and funded state and local agencies (well-armed with the naloxone antidote), deaths from illegal opioid overdoses, even from fentanyl, probably peaked before the end of 2018.
I know, I know: President Trump just celebrated the drug-overdose mortality decline in his SOTU address. But again, let's not get carried away: The downward slope in the death rate is thus far very shallow--a lot less steep than the upward slope that preceded it.
What about cancer deaths? The recent mortality news here is unquestionably good. (See “U.S. Cancer Death Rate Sees Biggest One-Year Drop on Record”). The long-term decline of smoking is of course a long-term positive tailwind for cancer death deaths, now kicking in for a lot of Boomers who quit decades ago. But the year-to-year improvement is probably more due to dramatic improvements in treatment success rates for very specific types of cancer, like melanoma. To say we're seeing the "biggest one-year drop on record" is not necessarily saying a lot, because cancer historically has been pretty resistant to large mortality declines.
On heart disease, the percentage decline seems unimpressive, less than one percent, but since heart disease is the single largest cause of death it was responsible for the second-biggest drop in total deaths in 2018. (The biggest was cancer; in third place was unintentional injuries.) Historically, since the 1970s, the age-adjusted decline in deaths due to heart disease has been by far the most important driver of overall declines in age-adjusted mortality. Most of this is due to medications (anti-hypertensives and statins) and to better diets. (See “Leading Cause of Death in High-Income Countries: Cancer, not Heart Disease.”) Over the last decade, however, improvement in heart disease mortality has slowed down almost to a full stall--largely due to rising rates of heart disease (specifically, heart failure) in younger generations. (See “Why U.S. Death Rate From Heart Failure is Surging.”)
Gen xers see less improvement
A look at mortality improvement by age bracket offers an alternative way to assess these different drivers. In terms of absolute numbers, by far the largest decline in age-adjusted deaths per 100,000 from 2017 to 2018 occurred among seniors. Most of the decline was due to significant drops in deaths from cancer and heart disease. Between age 35 and 64--an age bracket dominated by Gen Xers--we see much less improvement, both in absolute numbers and in percentage terms. Some gains in drug overdose deaths were cancelled out by higher death rates from chronic disease and suicide. (See "Adults Under Age 65 Driving Decline in U.S. Life Expectancy.")

The news was much better among Americans age 15 to 34 (mostly Millennials) and especially among late teens. Although deaths by age and cause of death have not yet been officially tabulated by the CDC, we can guess that these sizable declines must have occurred in suicides, homicides, drug overdoses, or traffic accidents--or some combination thereof. These four causes account for nearly three-quarters of deaths of Americans in the 15-to-34 age bracket.
