No punches pulled.
That's precisely how Hedgeye CEO Keith McCullough addressed investors who tuned into our webcast earlier this week. In particular, McCullough warned investors about “Quad 4” and the havoc it is wreaking (and will continue to inflict) on portfolios.
After having been bullish on U.S. growth and stocks for the better part of the last two years, our Macro team made a big pivot in late September.
Here’s a taste:
|
“Being long momentum, high beta, tech, growth, the Russell growth, that is not where you want to be. If you're scared because somebody had you in that, you should be more than scared. You should be very afraid at this point. Because you are only going to wear more losses. |
In addition, McCullough welcomed on two of our veteran analysts, Howard Penney (Restaurants/Consumer Staples) and Brian McGough (Retail) to discuss the investing implications in their respective sectors.
Below is an excerpt transcribed from this special investing webcast. (Click here to watch the entire 53-minute webcast.)
* * * *
Keith McCullough: I'm going to get right into it, get right into the process and outline what Quad 4 is. If we show you slide five on the process component of the deck, you can see that all we really care about is measuring and mapping the rates of change of the economy.
We do subscribe to nonlinearity. We do subscribe to math. We don't do the old wall stuff that didn't signal getting out of any of these things at the end of September—it was on September 27th.

McCullough: We care about whether we see accelerations or decelerations, or whether things are getting better or worse, not whether things are qualitatively good or bad, expensive or cheap.
Next slide. It may look a little busy, but again, when you're doing math, you do have to get a little bit busy. I mean, it surely beats staring at a 50-day moving monkey. This is our four-quadrant map. So what I'm showing you here are two things, growth and inflation on the x and y axis in rate of change terms. As you can see, all the quarters up until this quarter—nine quarters in a row—the US economy was in what we call Quad 1 or Quad 2.

McCullough: Quad 1 and Quad 2 are where you have growth accelerating. Quad 2 of course is when you have growth and inflation accelerating. Interest rates are going up, the Fed is going, hawkish. Does it sound familiar? It should, it was our call for two and a half years.
Now, Q4 is Quad 4. So you see back down there in the bottom left corner, you have both growth and inflation slowing at the same time. Again, that's in rate of change terms.
If you want to look at a bar chart of this, which is a lot easier to look at, for those of you who are new to our process, just the time series of this is on slide 13. This is GDP.

McCullough: I think that most things macro at this juncture, if you haven't seen our work, have to do with awareness. If you missed the move, then you were probably at least unaware of a lot of things. We want to make you aware.
So, the bottom of year over year GDP growth was of course in Q2 of 2016. I say, ‘of course,’ because anyone who subscribes to the rate of change process should know that. You should not risk manage markets unless you know that. You shouldn't know the 200-day moving monkey, and not know where GDP bottomed.
Moreover, you should know that it has accelerated for nine straight quarters. So, what we're saying is from the 1.3%, which is the low on that chart, to the current forecast that we haven't, again, it's more like a “nowcast.” We're using a predictive tracking algorithm, or a modern day mathematical tool, to drop in there with a 2.77% number. The green bar is lower than Wall Street's red bar. The way that Wall Street will read this is as a big GDP miss, which is on the next slide. We can show you our current nowcast for US GDP growth, the number that Wall Street stares at, is going to collapse to 1.22%.
This is fully loaded with every economic data point that's been reported, that has back-tested as relevant in our model. As you can see Wall Street is well ahead of us.

McCullough: Actually, this is the first time in the last five quarters that we've been below Wall Street. We used to be well ahead of Wall Street. That was of course before you saw the 4.2% and the 3.5%. So that's the only half of the story. The other half of course is inflation peaking and rolling.
Inflation peaked in the second and the third quarter of 2018, July was that number, July was 2.9% on a year-over-year basis, which ended up with this quarterly average as you can see there of 2.7% and 2.6% respectively in Q2 of 2018. You're following the black bars there. And most importantly, you're not following a black bear kind of sort of your following black bear and you don't want to be eaten by that black bear, which is inflation expectations as it falls to our current nowcast for Q4 to see inflation fall from the cycle peak to 2.37%. And then as you can see in the blue bars that follow that, we’re well below Wall Street.
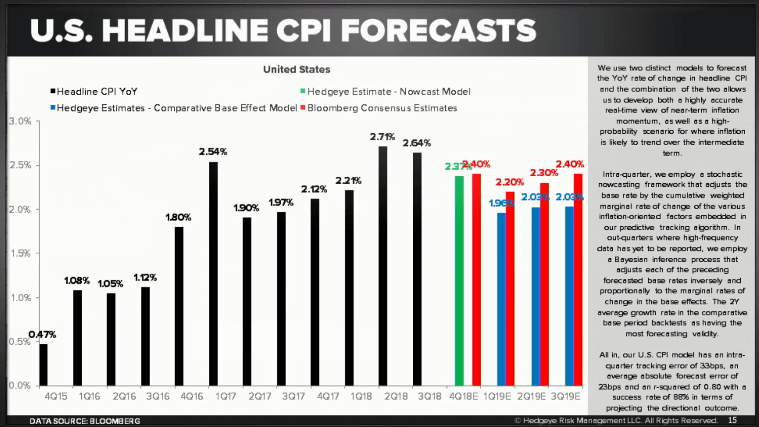
McCullough: So again, if you think about being long, the long bond or long, long term Treasuries or short term for that matter, that nowcast again on slide 15 would give you an outlook that is not consensus. But if it becomes reality, which we would consider the high probability situation, that inflation falls back towards 2%, that will give the Fed plenty of opportunity to go dovish.
And as the Fed debates going dovish, bond yields start to fall once they've actually gone dovish, bond yields may have bottomed, we’ll have to see about that. But in the meantime, we want to be long, long term Treasuries. We want to be long of course, bond proxies which include Utilities, Consumer Staples, etc.
Slide 28 can show you the regime of data as it's been reported on a look back on a go forward basis.

McCullough: So even if you are not mathematically inclined, and we would highly suggest that you become mathematically inclined, because again, you have to have an informed opinion that is based on actual numbers, not a feeling about markets or where you'd like them to be.
Don't forget a lot of people on TV, old wall TV that is paid to promote their own compensation schemes and that is largely having to do with a rosy outlook, which of course we don't have currently. Q4, as you can see on a color-coded basis, goes from bright green to a series of yellows and yellow is not as good as green inasmuch as going from red to orange to green was very bullish in rate of change terms.
Now we're going to go from bright green to yellow. Okay? Yellow, yellow, yellow.
Now if you look at this on a global basis, God forbid you're actually measuring and mapping the rest of the world as opposed to just jumping from macro tourists headline to headline every morning. When’s Trump going to meet with Xi? What are the Italians saying? Yeah, it's much more important to know what quadrant each of these countries are in.

McCullough: China and Italy in particular have been disasters this year. Our model called that on this, on this. Again, a lot of numbers. I don't use a lot of words here other than the ones coming out of my mouth, but you can see Quad1s and Quad2s, those are green because they're good. Yellow lights are not as good and red lights are very bad.
So as you can see, these are the top 20 countries in the world by GDP. They went into Quad 4 unanimously, the mean and the mode of that did in Q1 of 2018. That's when we went bearish on China are, had already gone bullish on Europe and went bearish on Emerging Markets in particular.
And as you can see, Quad 4 in Q4 is a global matter with the US joining it for the first quarter after nine greens in a row.
Alright, slide 66 two more slides. What do you do when margins are at peak? Do you buy the stock market? If you bought the stock market at any of those three tops, at least the last two, you would have been body-bagged don't get body-bagged. Okay? We don't want that to happen to you, your family or any of your net wealth.
Again, we're at the currently the third dot in the last 20 years where you could buy a stock because “it looks cheap” to a broker or a pundit that is calling it cheap on peak earnings. So when they're calling a cheap, they're using the wrong “e”.

McCullough: So if I tell you something looks cheap at 15 times earnings, it doesn't mean anything if the “e” is wrong. Okay? So what we're predicting here is, again, through dollar strength our call remains bullish on the dollar and rising wages. We're going to continue to see some margin compression from the cycle peak. So inasmuch as we have growth slowing, and we have inflation slowing, we have margins compressing.
Margins compressing is actually as dangerous as anything out there.
And guess what they have to do with? The two causal factors that are growth and inflation slowing. They give you deleverage on your P&L if you're one of these people out there that have made your own money by running your own companies. You know exactly what we're talking about. Of course, many of the people that you listened to on old wall TV, have never run a company or a P&L.
Last slide, slide 70. From a factor exposure perspective, this is going to get you into the learning mode. And again, it's not just what sectors and what asset classes you’re long or what currency—we want you to be long dollars and not long bitcoin. Not a bad call this year, right? Not a bad call indeed.
But again, from an asset allocation level, then we get into the sectors that we like because I pointed out here on the left side Consumer Staples is a good place to be, inasmuch as I said utilities is. But then on the right side where not to be—momentum stocks. This is when you go into the fourth quadrant. This back tests against economic realities. Don't forget, that's why we made the call.

McCullough: Being long momentum, high beta, tech, growth, the Russell growth, that is not where you want to be.
So if you're scared because somebody had you in that, you should be more than scared. You should be very afraid at this point. Because you are only going to wear more losses. Okay? You can hope and pray for an Italian or Trump or Xi or whoever you want and that might give you a good day like it is today. But again, it's only a good day from a very, very bad place in your portfolio.
Rule number one in risk management: Don't lose money when everybody else is. Our subscribers have not. That's what we're trying to help you join them here in the coming months. And as Darius pointed out, guess what, we're still in Quad 4 in Q1 of 2019. And it's still not yet the end of November. Okay?
