
Editor's Note: Below is a brief excerpt from today's Early Look written by Macro analyst Ben Ryan. Click here to learn more about the Early Look.
|
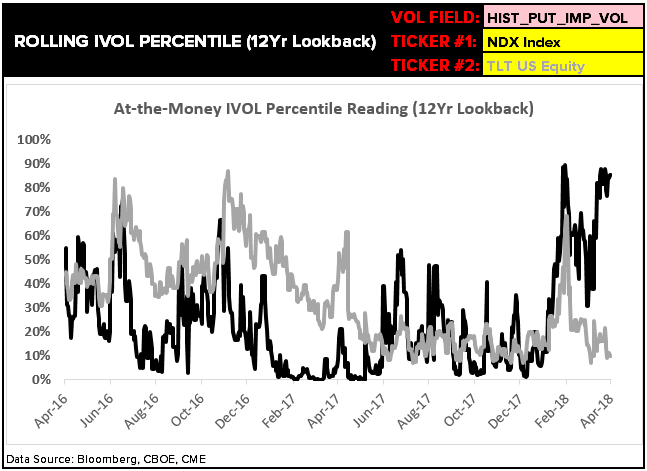
In our Chart of the Day, we show the 2017 – 2018 hand-off in volatility expectations from Fixed Income, Currencies and Commodities (FICC) to growth equities. Many charts exemplify this top-down trend of low relative volatility trends in fixed income and many commodities, but more specifically we are showing a rolling percentile view of implied volatility in the long-term treasury ETF (TLT) and the Nasdaq 100 Index in the chart. |

