
Below we draw notable conclusions from our daily monitoring of derivatives-market sentiment factors. We publish key conclusions ~monthly in cohesion with changing conditions. Because many of these factors shift in the short-term, this note is intended to be a summary of process.
In our last update (VOLATILITY RESET ) we spent quite a bit of time outlining the shift in rates-rising and Inflation sentiment as seen in derivatives markets, and believe it’s an important market battle to keep under the microscope.
Now that the market has digested yesterday’s rate hike, the reality is that long-term nominal interest rates have moved very little m/m. We would argue a marginal reset of inflation expectations is a major driver. Christian Drake went through this theme in a note last night which visually outlined the rollover in break-even rates and inflation swap rates globally in the last few weeks: The RoC Report
Below we will expand on our Early Look From Last Week (Winners Still Winning?) which looked at higher volatility in Large-Cap Growth (i.e. FAANG) relative to Small-Cap indices like the Russell 2000 as a roundabout view on interest rate volatility due to index weightings. Again, muted rate-volatility, inflation expectations and a stable USD m/m are at the core of this theme in volatility markets.
As Darius Dale and Keith have said, "USD is the new VIX right" now when we think of the carry trades and fund flows associated with the low-volatility, global growth accelerating backdrop of 2017.
----------
Corresponding charts for the two, bulleted call-outs are at the bottom of the note in order of mention…
Equity Sector & Style Dispersion
Far and away the largest call-out heading into February was the rates-rising, reflation bias embedded in sector dispersion which was a key topic in our 02/02 black book: Which Side of the Boat Are You On? . In other words, forward volatility traded at deep relative discounts vs. SPY in Energy & Financials. Energy repriced swiftly and arguably muted interest rate volatility m/m has kept this downside dispersion in Financials and the Russell 2000, especially when SPX and NDX volatility has been pulled higher with step-up in large-cap growth volatility.
*Note* “Dispersion” is just the term used to describe where forward-looking “implied” volatility trades in a sector or factor vehicle relative to an underlying index. Much of the time dispersion will mirror recent relative performance. When there is a large shift in volatility expectations, we first want to identify it and then understand the narrative.
Right now, Russell 2000 (RTY) volatility expectations are significantly tighter vs. S&P 500 (SPX) than they have been historically. The percentile readings in the first two visuals below are self-explanatory but here is some additional color:
- Russell 2000 (RTY) front-month IVOL trades at a ~40% premium to SPX IVOL historically. Right now, there is virtually no premium
- Dissecting the volatility indices, the VIX/RVX ratio series trades at 10yr highs
- At the capitalization level, 60-day IVOL in the Russell 2000 ETF (IWM) historically trades at a 6-point premium to the Russell 1000 ETF (IWB) and this spread is currently less than a point of volatility wide.
- VXTLT: The treasury volatility index that tracks options on TLT is at a new cycle low as of this morning. Rates and volatility lower are crushing rates-rising narratives
In a roundabout way we get to the conclusion that muted interest rate volatility in the face of a crowded rates position has suppressed volatility expectations in equity exposures leveraged to the Financials (i.e. R2K); And, Large-Cap growth volatility (i.e. realized & implied FAANG fears) created this capitalization and style shift narrative we mention above.
As we concluded in that Early Look Last Week:
“The winners continue to win [i.e. growth pummeling value YTD across the Russell Index capitalization & factor spectrum - see our Russell Factor Performance Table below], but in 2018 it’s volatility management that has been a curveball for the underlying outperformance. We continue to ride the same exposures while more intensively monitoring underlying internals and potential phase transitions.”
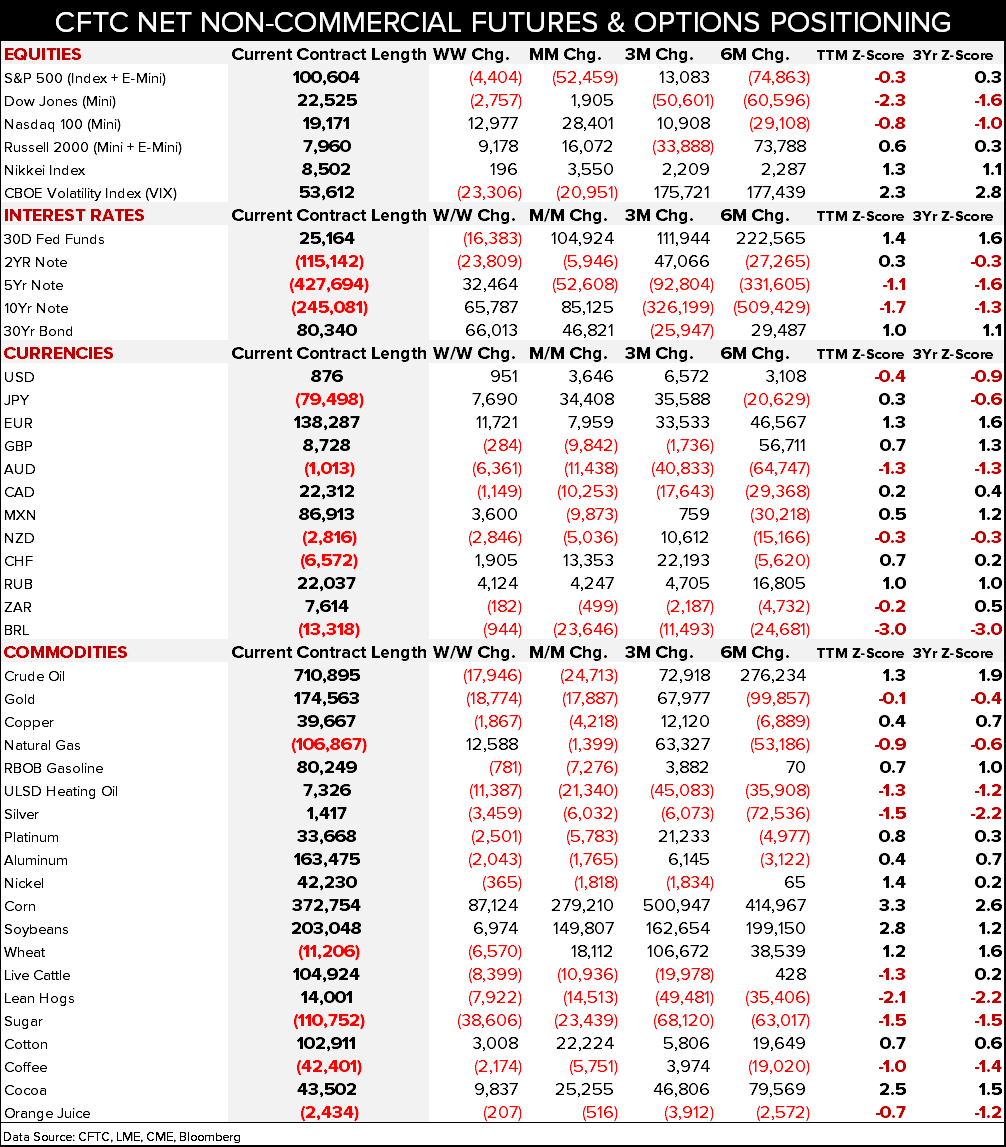
CFTC Net Futures & Options Positioning
And how has this crowded rates-rising bias fared over the last two months?
In performance terms on the back-end of the curve, not great:
5yr yield: -5bps from 03/20 high
10yr yield: -12bps from 02/21 high
30yr yield: - 16bps from 02/21 high
This pause in rates has helped to partially trim the crowded speculative net short positioning but we would by no means call it a complete "wash-out" of one of the most widely held consensus macro themes:
5Yr: -52K contracts shorter on the margin m/m but +32K w/w (-1.1x TTM Z-Score). Consensus is currently net short 427K contracts. The all-time high in net short positioning was -504K during the week of January 16th. 5-year yields made a new highs this week at 2.69% before fading on the rate hike and commentary yesterday.
10yr: +85K contracts on the margin m/m (still -1.7x TTM Z-Score)
30yr: +47K contracts on the margin m/m (+1.0x TTM Z-Score)


Ben Ryan
dty
