
TREND WATCH: What’s Happening? The latest employment indicators appear to show an economy operating near full capacity. Why then aren’t wages rising faster? That’s the question at the heart of a recent San Francisco Fed report, which suggests that the retirement of high-wage Boomers is in effect suppressing average wage growth.
Our Take: Our analysis finds that the quantitative impact of this trend has been negligible. The vast majority of the change in average wages since the Great Recession cannot be attributed to the shifting age profile of the U.S. workforce. In fact, today’s high-earning older workers are working longer than ever, which actually boosts average wages.
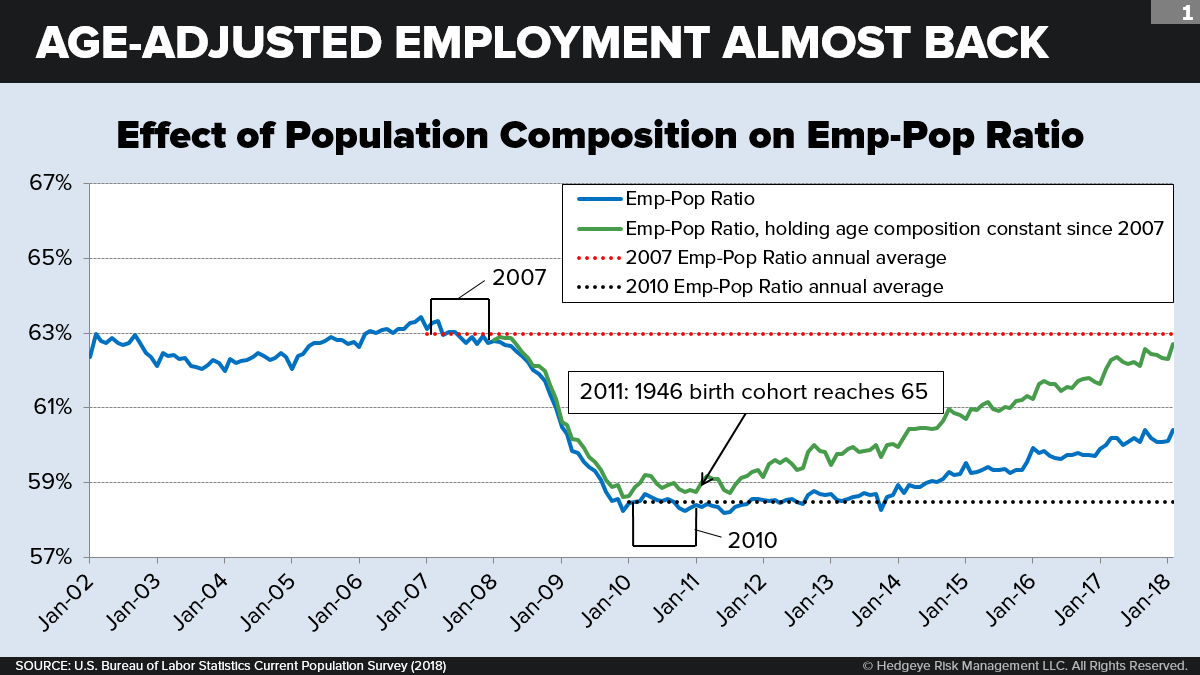
Good news continues to roll in on the employment front: Seasonally adjusted unemployment matched its post-GFC low of 4.1% in February, with the U.S. economy adding 313,000 jobs, well above expectations. Also in February, initial jobless claims fell to a 45-year low. As we have often shown, the U.S. employment-to-population ratio—when properly adjusted for our changing age structure—is now very close to its last-cycle peak in 2007.
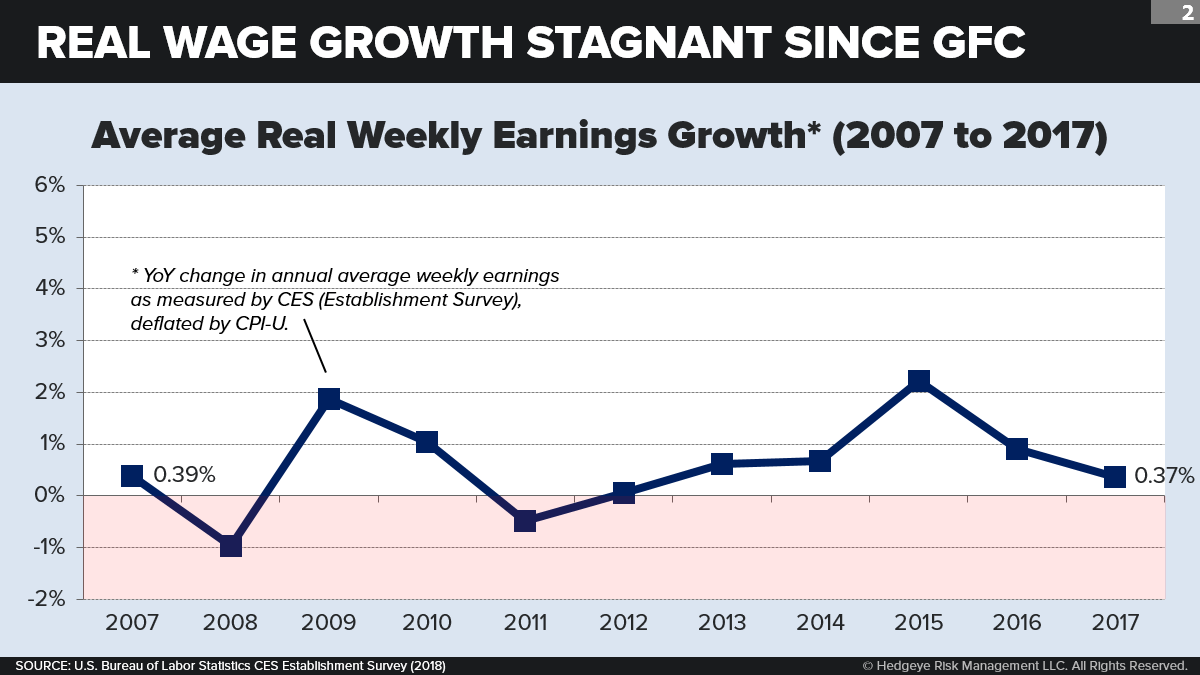
Labor market economists are accordingly asking themselves a very sensible question: If we are close to full employment, why isn’t wage growth (real or nominal) picking up speed? According to the CES Establishment Survey, real wage growth has averaged well under 1% annually since the Great Recession (+0.68%) and doesn’t seem to be accelerating with time. The only years in which growth was greater than 1% were the post-crash pick-up years of 2009 and 2010—and then again 2015, when a 2.2% spike in real wages (triggered by plummeting energy and food prices) coincided with a broader rise in median household income. (See: “A Good Year for Middle America.”)
The San Francisco Fed is the latest to come up with a hypothesis to explain this puzzle. In a groundbreaking paper published in 2016 and updated last summer, authors Mary C. Daly, et al. suggest that demographic headwinds are to blame: “While higher-wage Baby Boomers have been retiring, lower-wage workers sidelined during the recession have been taking new full-time jobs.” In their view, the disappointing trend in the average wage is an artifact of the economy skewing more toward younger (lower-paid) workers and away from older (higher-paid) workers. The typical worker at any given age is therefore doing “better” than the average. The story has gotten plenty of run in news outlets from The Wall Street Journal to Bloomberg Business to MarketWatch.
If true, this theory would change how economists parse the data. It would be good news for the economy to the extent that unretired workers are actually experiencing higher wage gains than indicated by the average wage number. If these older workers’ higher wages reflect higher marginal product, it might also help explain lagging productivity growth. (Hopeful prediction: Once all those workaholic Boomers are retired, this negative influence will disappear.) It is also a helpful story for Fed hawks who don’t want to back off from tightening: See, they can say, wages really are accelerating—we just can’t see it in the average number.
But is the theory true? Let’s find out.
INSIDE THE NUMBERS
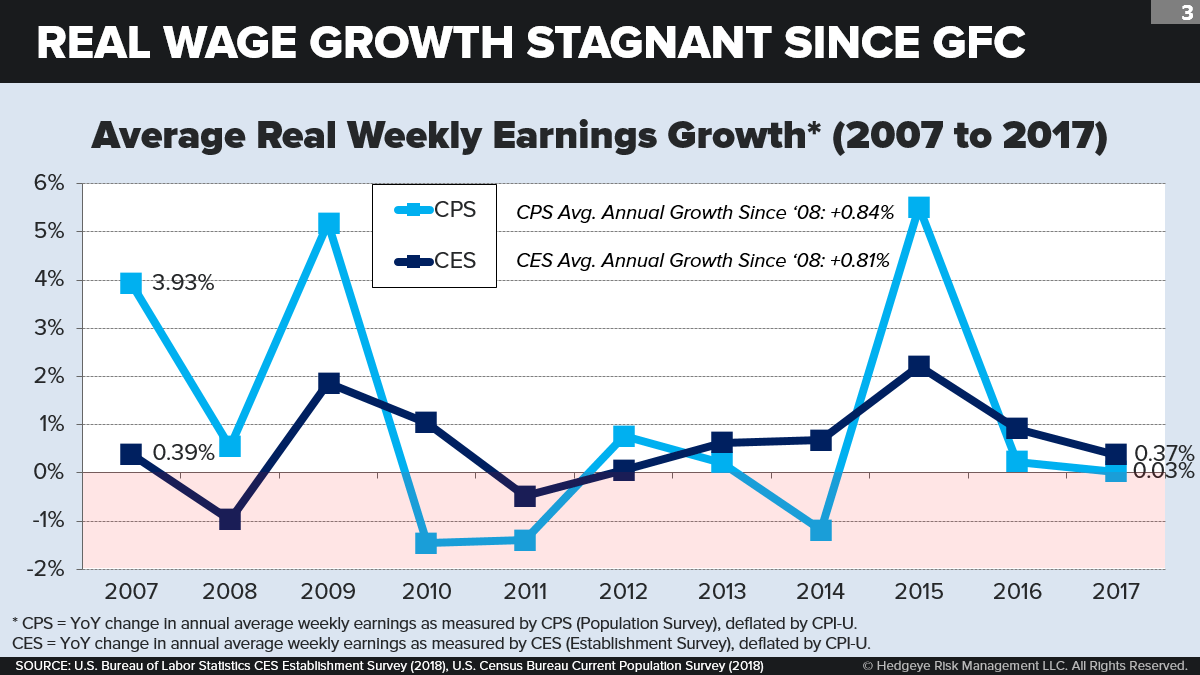
In our analysis, we can’t examine the CES numbers directly because (as establishment “payroll” data) they include no personal information, such as worker age. So instead we use annual data from the CPS household survey, which includes a detailed and vetted age breakdown of full-time earnings per worker. This should track the CES series pretty closely. While the CPS full-time average wage is more volatile year over year than the CES average wage, the growth rates over time are similar. (See below.) True, our CPS series only includes full-time workers, but the part-time share of CES payroll is believed to be small and part-time shares by age don’t show much fluctuation over time.
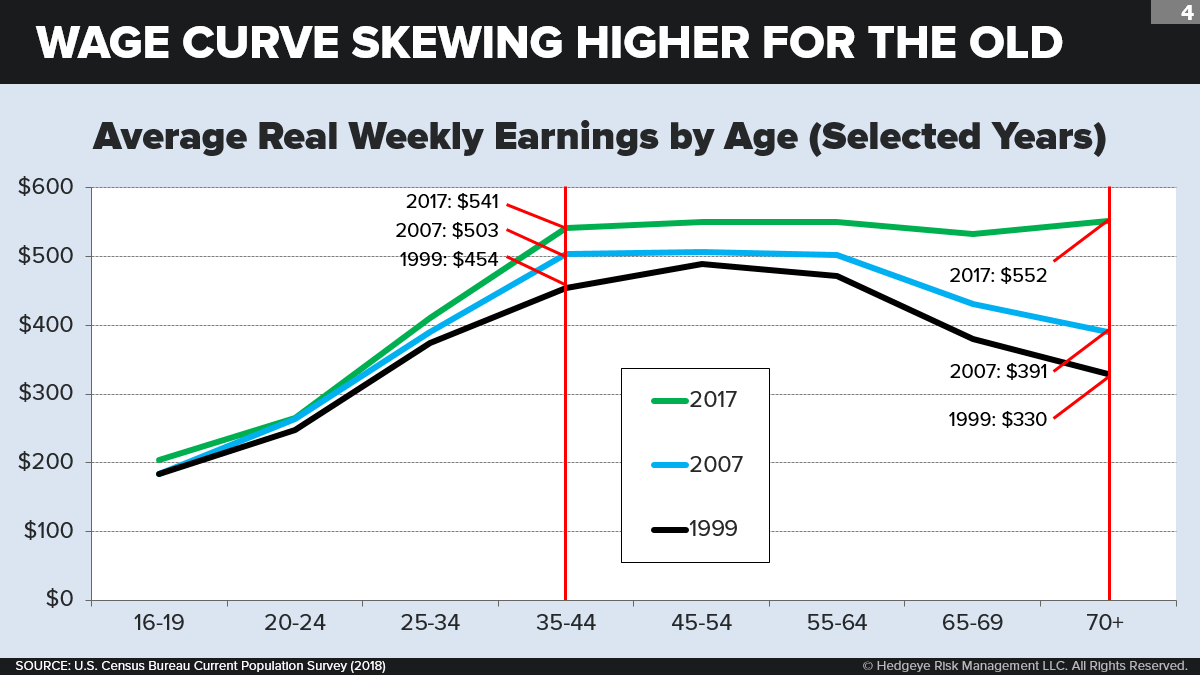
OK, let’s look next at the difference in wages by age. The basic assumption of the Fed theory is that older people get paid more. And, yes, the CPS data bear that assumption out. In 2017, for example, a full-time worker age 55-64 earned $550 per week—versus $248 for a worker age 20-24. So if the workforce is “skewing younger,” that could in theory have a negative impact on average wage growth.
There are two other aspects of this age-wage curve worth pointing out. First, the big threshold between lower and higher wages is age 35. Second, the curve has been bending upward for older (but not younger) age brackets over the past twenty years—and dramatically so for so-called “retirement age” (age 65+) workers. We will come back to both of these points.
Now we come to our analysis. Essentially, we have taken the CPS average full-time wage data and we have broken down each year’s growth into the following components:
(1) The growth due only to wage changes in each age bracket. We derive this by holding the number of workers in each age bracket constant while we allow the wages by age to change in the next year.
(2) The growth due only to changes in age composition of workers. We derive this by holding the wage in each age bracket constant while we allow the age distribution of workers to change in the next year.
(3) There is also a small interaction term—which in this case is so infinitesimal that we have left it out of the results.
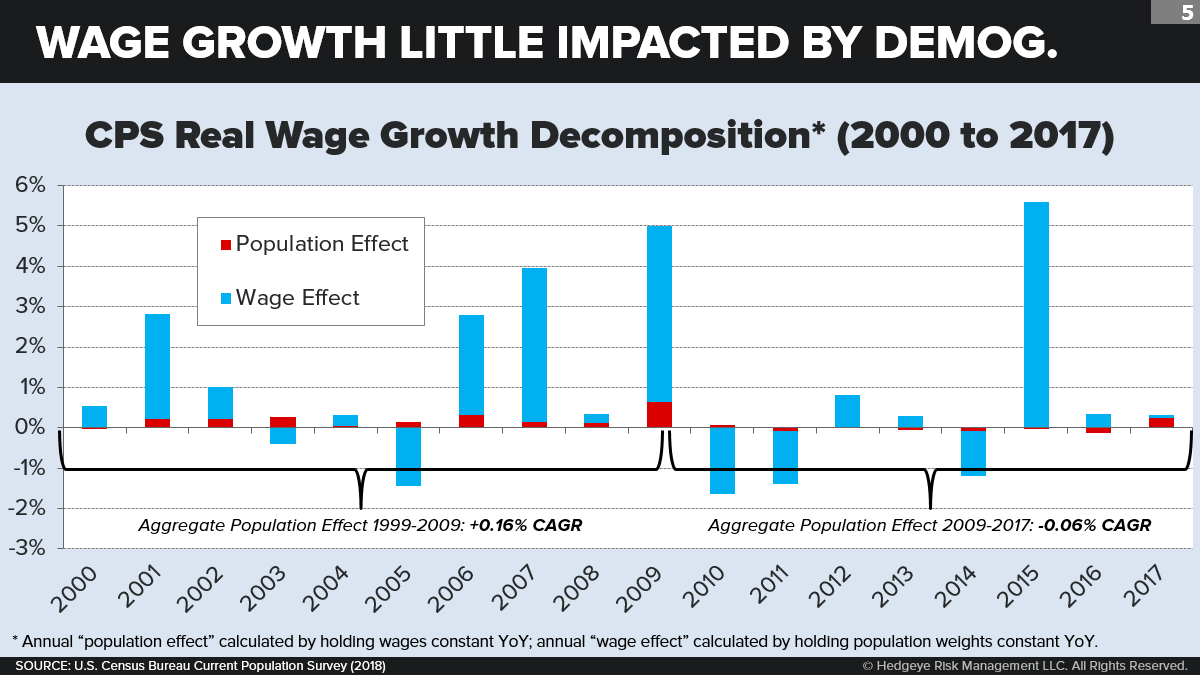
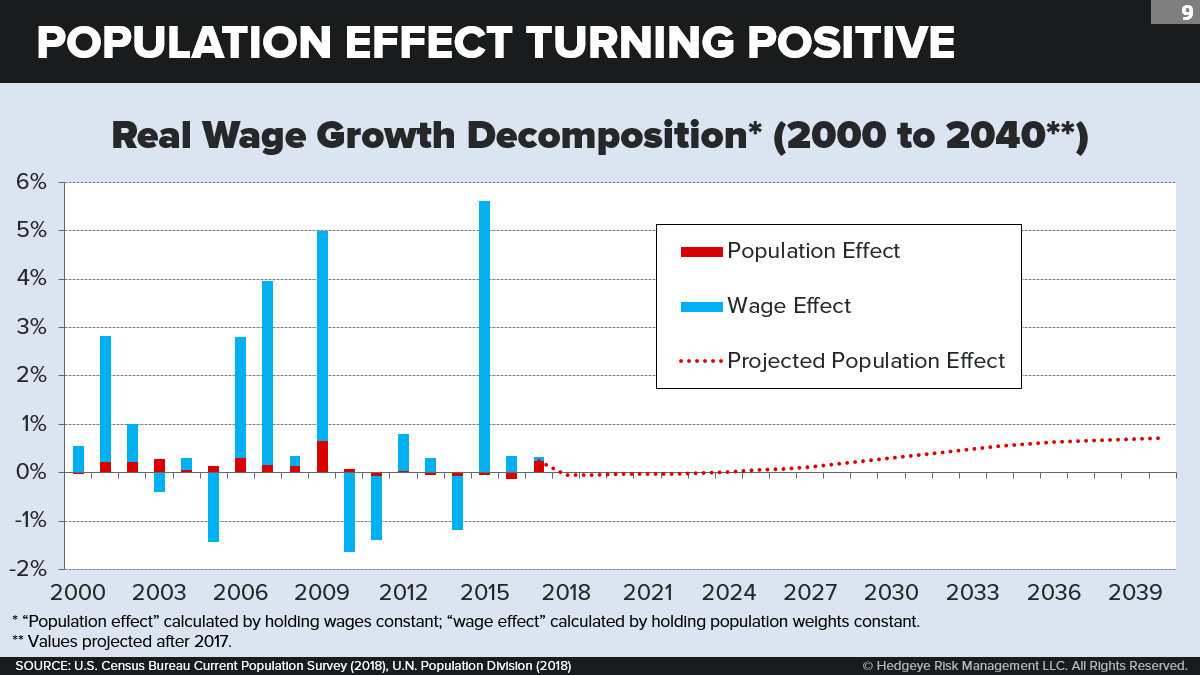
When we decompose wage growth this way into a “population effect” and a “wage effect,” we discover two things.
Most importantly, demographic shifts have had only a very small impact on average wage growth in either direction. In any given year going back to 2000 (change from 1999), virtually all yearly wage growth, positive or negative, is generated by changes in wages by age, not in changes in worker numbers by age.
To the extent demography does have an effect, however, it is true that the effect has been in the direction suggested by the Fed. From 1999 to 2009, demography added 0.16% yearly to average wage growth. From 2009 to 2017, on the other hand, demography subtracted 0.06% yearly from average wage growth. So there was a 0.24% “negative swing” from one period to the next.
What explains this swing? Well, the Fed is correct as far as it goes: In the decade prior to 2009, the large Boom Generation was maturing in midlife while the small Silent Generation was retiring. Starting in 2011 (when the 1946 birth cohort reached age 65), the Boom Generation began to retire. The large positive population effect in 2009 was due to layoffs among younger (more than older) workers—who, during the ensuing recovery, tended to dominate the number of new employees and thus suppress wage growth. So the timing of the Great Recession may exaggerate slightly the demographic contrast between these two periods. But the basic contrast is clear enough.
What needs some explanation, perhaps, is why the demographic effect is relatively small and (especially) why in no period has it actually pushed wages down to a significant degree.
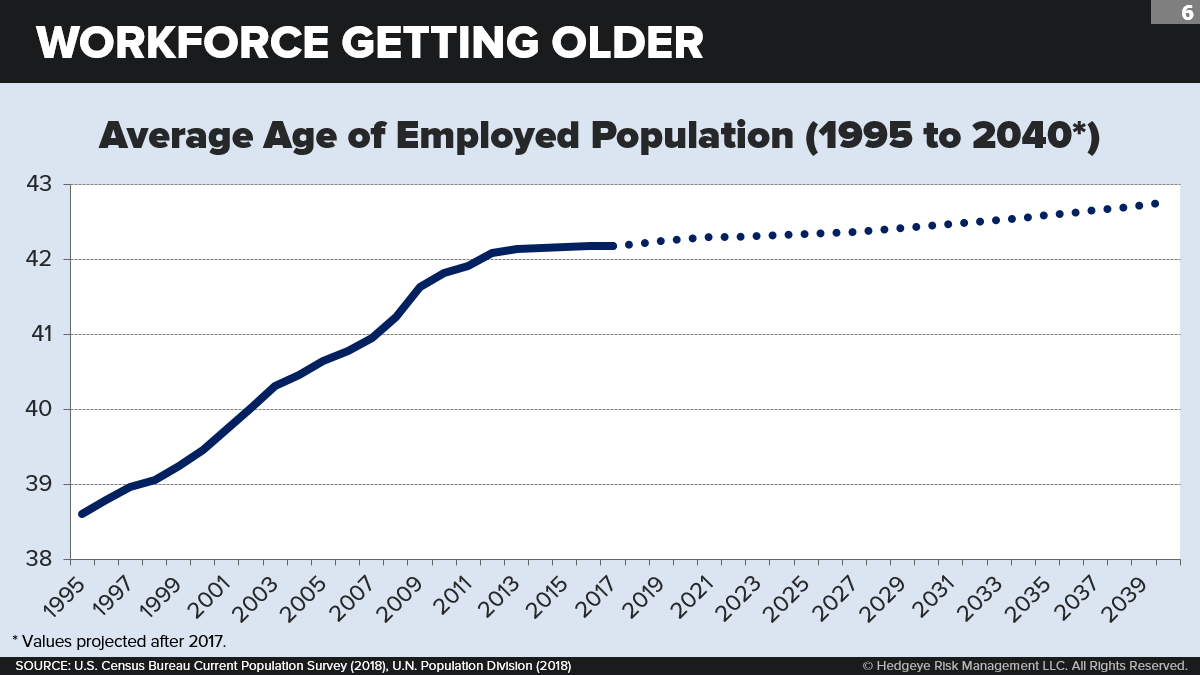
One easy way to assess historical age shifts in the workforce is to look at the average age of all full-time CPS workers. Here we see a steady rise in the average age from the mid-1990s to 2009, as Boomers were aging within the workforce and (during most of those years) a small Generation X was entering the workforce. This growth slowed down after 2009 and stopped entirely from 2013 to 2017 (staying constant at 42.2 years for five years straight). That’s been the impact of Boomer retirement—not to reduce the average worker age, but simply to flatten it out for a while.
In the future, using a population projection that assumes unchanged employment by age, the average age will start rising again. So whatever impact the Boomer retirement has on average wages, well, that is now mostly in our rear-view mirror.
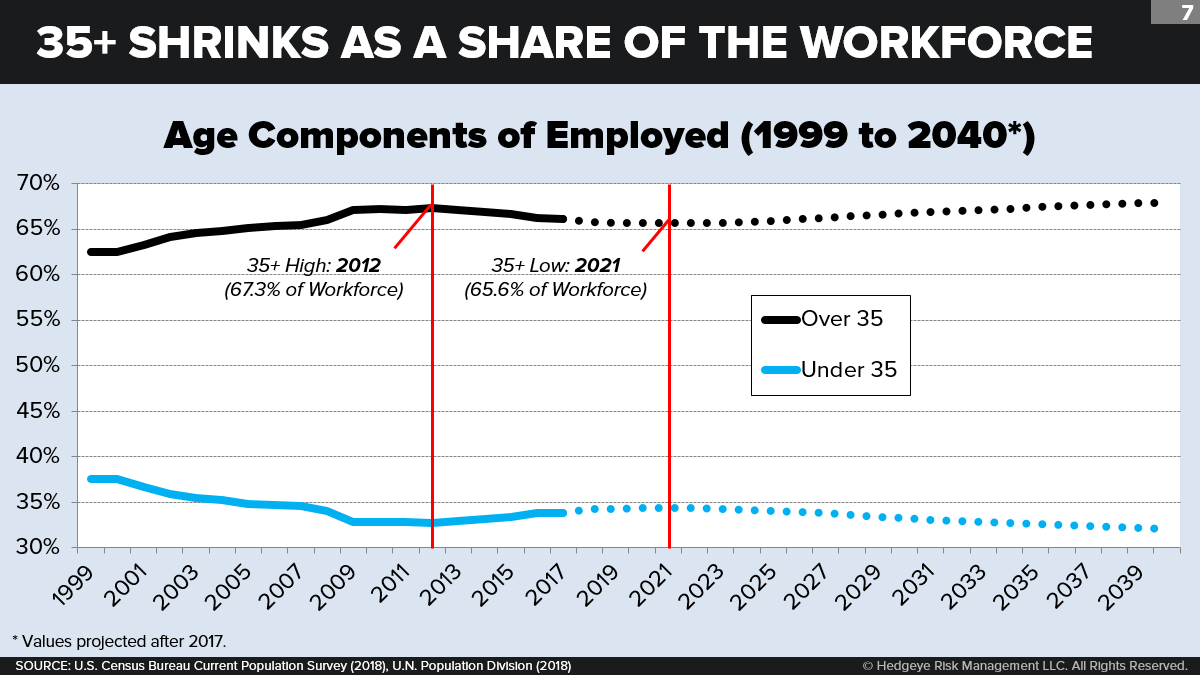
We can get a bit clearer view by going back to our earlier observation that the big threshold between low and high wages by age was 35. So let’s break the workforce into 35-plus and 35-minus shares and look at the trends over time. We see a similar story. There is a steeply rising 35-plus share up until 2009. Then that share roughly plateaus until 2012 (a high point) before gradually declining until 2021 (a projected low point). Thereafter, the average age gradually rises again. Here again, we don’t notice any dramatic decline.
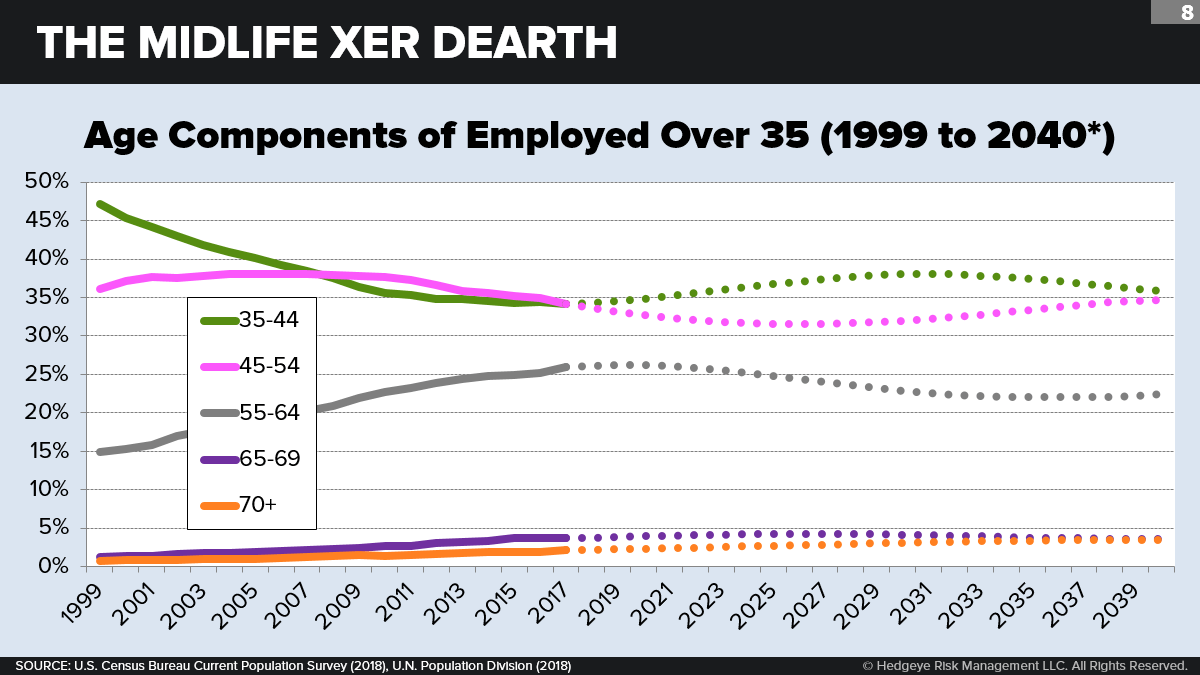
For a still closer look, let’s break down the 35-plus ranks into their various age brackets. To be sure, we see here a steep (Boomer-fed) rise in the 55-64 share from 2001 to 2011 as the large 1946 birth-cohort bow wave moved into this bracket. Starting in 2011, this bow wave has been reaching age 65. The ascent of the 55-64 share has since slowed. It will reach a peak (at 26.2% of all workers) in 2020—and thereafter fall.
Running the other way, however, is the growing tide of workers moving into the 35-plus ranks. From 2000 through 2011, the baby-bust Gen-X cohorts reaching age 35 were shrinking every year. In 2011, however—after the smallest 1976-born “buster” cohort reached 35—the incoming 35-year-olds have been growing every year. Today, these incoming 35-year-olds are Millennials, whose biggest-ever cohort will reach 35 in 2025.
So just as the “baby boom” started to hit 65, the “echo boom” has started to hit 35. This rising age-35 inflow has powerfully mitigated the negative wage impact of the Boomer retirement.
What about the future? In our look forward, we started with a single-year (U.N., 2016) population projection by age bracket and assumed that the employment share in every bracket would remain identical to what it is today. We also assumed wages by age to be identical to what they are today. The result shows that today’s barely perceptible negative age effect on wages will gradually decline from -0.05% in 2018 to zero by 2025. Thereafter, the age effect will turn positive again and gradually increase with the aging of the “echo boom” Millennials. It will hit +0.07% in 2037.
OTHER PROBLEMS WITH THE FED’S ARGUMENT
It’s clear that the aging of Boomers has had only a minimal quantitative effect on average wage growth in recent years. And, to extent that it did slow down wage growth over the last decade, that effect is now ebbing and (within a decade) will disappear entirely.
So the Fed got the demographics wrong. But that’s not all they got wrong. There are two additional reasons—not demographic, but behavioral—that explain why the aging of Boomers has not perceptibly suppressed wage growth.
For one thing, high-wage older workers aren’t simply dropping out of the workforce once they hit age 65. They are, to an increasing degree, working page age 65. The G.I. Generation drew down the average retirement age through the 1970s and 1980s. But starting in the late 1990s with late-wave Silent—and even more with Boomers—the average retirement age has been rising. At age 65-74, the LFP (labor force participation rate) has climbed from 12.5% in 1996 to 19.2% in 2016. At age 75+, it has climbed from 4.7% to 8.4%.
In the aftermath of the GFC, seniors were famously the one age bracket that never suffered a negative employment quarter, in part because they were increasingly likely to stay on the job or to seek new employment. It’s hard to see in Chart 8, but 65-70 year-olds have climbed from 0.8% to 3.7% as a share of all workers over age 35 since 1999. And 70+ has climbed from 0.7% to 2.1%. This tripling or quadrupling is not just due to demographics.
Altogether, there are over one million Americans age 65+ who are working today who would not have been working at the LFP rates of twenty years ago.
Plus, there’s another kicker. Go back to Chart 4, where we noted that not only do wages rise with age but also that this curve has been bending counterclockwise over time. In other words, wages have risen a lot faster for the oldest age brackets. How much faster? Well, over the last twenty years, real wages for workers 65+ have risen around 2% to 3% per year. No bracket under age 65 has exceeded 1% per year. Since 2007, amazingly, the average real wage for 70+ workers has grown by a 3.5% CAGR.

Many explanations could be offered for this senior wage boom. Disaffected Xers and Millennials may claim that Boomers have always been pretty good at rigging institutions to preserve a good deal for them (two-tier wage contracts, licensure laws, etc.). There may be some truth to that. Probably more important, however, is the growing bifurcation between Boomers who remain employed past 65 (disproportionately professional, high income, and high education) and those who retire early, often on disability (disproportionately low income and low education).
These two explanations may overlap. But clearly the correlation between socioeconomic status and work among seniors has reversed over the last two or three generations. Among G.I.s, the lowest-paid workers retired at the oldest ages. Among Boomers, the highest-paid workers are retiring at the oldest ages.
That’s enough to push the average wage way up for these older age brackets. And this rising average, in turn, combines with the growing share of Boomers working past age 65 in a powerful multiplier effect to keep wages high. Some Xer and Boomers may dearly pray that these privileged Boomers hurry up and retire. But so far, they’re happy marching to their own drummer.
