
Below we draw notable conclusions from our daily monitoring of derivatives-market sentiment factors. We publish key conclusions ~monthly in cohesion with changing conditions. Because many of these factors shift in the short-term, this note is intended to be a summary of process.
In our last update we focused almost exclusively on the rates-rising, reflationary bias embedded across equities and FICC as gleaned from derivatives and volatility markets: Ripple Effects of Rate Narratives (FX, Yield Sensitivity)
Below we provide a bulleted update on this topic and provide key call-outs now that volatility has reset. The corresponding charts are below the bulleted takeaways in order.
If you haven’t read our Early Look this Morning, it’s a great one-stop shop for our house views and how those views have fared of late: Boring and Un-Cute
----------
U.S. Equities (Sectors & Factors): On the bounce growth sectors (XLK, XLY) still own the trending performance against yield-sensitive sectors (XLU, XLP, XLRE) in the S&P 500. The Russell Factor indices tell the same story with growth outperforming value across the capitalization spectrum (R1K, R-Mid, R2K) YTD. Volatility markets have adjusted accordingly which can be a risk to riding what’s worked – the preference of growth over value can be seen in implied volatility across the term structure, although this spread isn’t nearly as wide as it was in Q2 and Q3 of 2017.
Our biggest flag in domestic equities into February was the consensus bullishness on two “reflation” pockets: energy and financials. Financials continue to be a sector leader with rates moving like they have. However, energy sector equities have seen a good pullback in February, and the call-out we would make today is that volatility markets have shrugged-off that move so far when we look at relative forward-looking volatility (implied dispersion) – this is a market vote on expectations gleaned from options markets. See our first two charts below where we show energy and financials implied volatility across the term structure relative to the S&P 500 ETF (SPY). As we concluded in yesterday’s Early Look : “the continued ascent of long-term nominal rates, inflation swap rates, and break-evens suggest the market continues to shed any semblance of a rollover [in reflation] risk going forward.”
CFTC Positioning (Crude Oil, Rates): Net Futures & Options positioning in crude oil touched an all-time high of +784K contracts heading into the first week in February as realized volatility was trending at its lowest level since June of 2014. This net long position has been trimmed to +736K contractst this week, but the speculative net long crowd is still much larger than at any point prior to 2018.
We also look at the speculative CFTC open interest relative to things like average daily trading volume and total open interest. Speculative open interest relative to total open interest still sits at an all-time high in the crude oil futures market.
Below is both a TTM and 3yr Z-score factor screen of the most divergent (long side and short side) speculative open interest across equity and FICC derivatives markets.
On the other side of the long crude oil position, net positioning in the 10yr contracts has moved 415K contracts shorter on the margin over the last 3-months to net short 330K. The short position in 10yr futures and options contracts is one of the most extended in global macro.
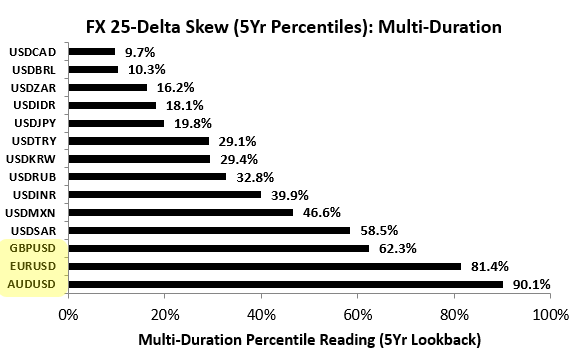
Currencies (USD): With the U.S. Dollar Index +83bps m/m heading into the day, the bullish skew tilts in EUR, AUD, GBP options markets that were a key focal point in our previous update have flattened out considerably.
Volatility surfaces in EUR, GBP, AUD were tilted most bullish against USD in 10 years a month ago. We look at this dynamic via FX risk reversals which compare the cost of upside vs. downside in currency options markets. We show this flattening in risk reversals in a percentile chart below – previously those currency pairs traded at percentile readings right near 100% on 5yr and 10yr windows. 1-Month of performance may not be a long time, and 83bps may not be a huge move, but these consensus views were most crowded at seemingly the wrong time although time will tell.
A “risk reversal” reading just takes the difference in implied volatility between buying upside calls vs. downside “puts” at any point in time.
Charts:


Ben Ryan
dty
