
This special guest commentary was written by Christopher Whalen. It was originally posted on The Institutional Risk Analyst.

Fed Chair Janet Yellen’s defense of the benefits of regulation last week in Jackson Hole probably killed her chances for reappointment, but the more pressing reason to see Yellen return to the private sector is visible in the US real estate market. Chair Yellen and her colleagues have created large bubbles in many assets classes from residential homes to commercial real estate to construction lending. As in the 2000s, this latest bout of asset price inflation will not end well for banks or investors.
In this issue, The Institutional Risk Analyst looks at the most recent bank portfolio data from the Federal Deposit Insurance Corp for Q2 2017 to see what it says about asset prices and inflation. For some quarters now, the credit statistics for the $16 trillion asset banking system has been too good to be true, in some cases suggesting that credit events have no cost. The last time that these circumstances existed was the mid-2000s, when several large mortgage banks were reporting a negative cost – that is, a profit – from default events.
The same real estate market dynamic that allows growing numbers of Americans to take cash out of their homes is depressing the cost of loan defaults to half century lows. Even faced with this rather striking situation, our faithful public servants on the Federal Open Market Committee can actually stand up in public and say that inflation is too low. The skews in the credit world are so large that some banks are actually earning a profit on recoveries after a loan balance is repaid in full.
First let’s examine credit trends for 1-4 family mortgages, a $2.4 trillion asset class for US banks. Loss given default (LGD), a fancy way of expressing net charge-offs, shows the average loss for 1-4 family mortgages. At the end of Q2 2017, the LGD for this asset class was just 24%, the lowest loss rate net of recoveries since at least 1990. Last quarter, the volume of defaults on 1-4s fell below $1 billion or less than 1/10th of one percent of total loans.

The chart above suggests that residential assets prices are quite high, as reflected by the high recovery value -- 76% -- implied by the 24% LGD in Q2 '17. Since 1990 the average loss rate after a default for 1-4 family loans is 67%, thus it seems reasonable to ask when US home prices will adjust downward. How you feel about that depends upon whether you view the extraordinary home price inflation seen since 2012 as being permanent and thus immune to mean reversion.
The situation in the world of construction lending is even more profound, with LGD’s well into negative territory for the first time since the 1990s. In Q2 ’17, LGD on those few construction loans that actually defaulted was negative 94%. Given that C&D loans tend to be mostly multifamily paper and have loan-to-value ratios around 50%, when you see a bank reporting such unusual profits on defaulted loans it suggests that the value of the real estate has basically doubled since the loan was made by the bank. Note that the downward move in LGD coincides with the end of quantitative easing by the FOMC.

Of note, home equity lines of credit are showing similar behavior to the 1st lien mortgages, which typically stand in front of HELOCs in the credit stack. LGD for HELOCs reached a mere 31% in Q2 ’17, implying that banks are recovering almost 70% of the value of a loan when a borrower default occurs. The 25-year average LGD for HELOCs is 65%, illustrating that Chair Yellen and her colleagues on the FOMC have literally turned the world of real estate credit on its head. As the chart below suggests, the value of the collateral backing HELOCs has surged since 2012.

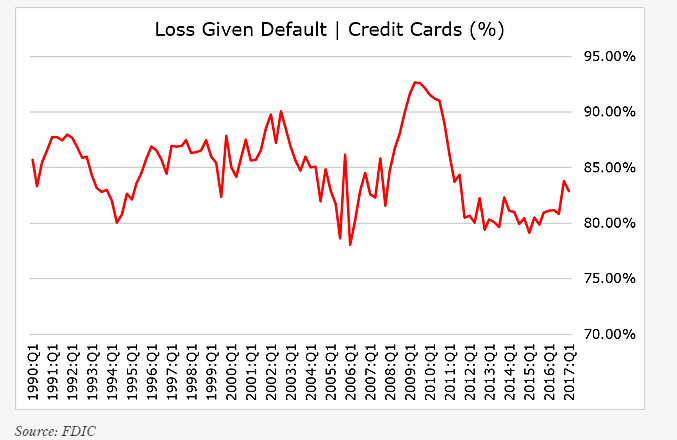
Next we move to the $780 billion in credit card loans held by US banks, an asset class that has seen recent growth after years of flat to down portfolio levels. The interesting thing about credit card loans is that they are totally unsecured. Thanks to the generosity of Chair Yellen and the other members of the FOMC, credit card loss rates have fallen dramatically since 2008. First let’s take a look at default and non-current rates, which are both turning up after the years of irrational easing by the FOMC.

Notice in the credit card chart that charge-off rates are above that for loans which are non-current, the opposite of this relationship for most other loan types held by US banks. This is due to the fact that, being unsecured, these credits tend to be charged-off before they have an opportunity to be classified as non-current. The next chart below shows LGDs for credit card loans, which at 83% is at the lowest levels since the mid-2000s.
The real question that the previous two charts raise is much on the minds of bank analysts, namely how much future default risk has been buried under the comforting blanket of low interest rates. The average rate of net-charge offs for credit cards is almost three quarters of a point above current levels, again begging the question as to when we shall revert to the mean. The answer to that question will have a significant impact on bank earnings and the ability of banks to return excess capital to shareholders.
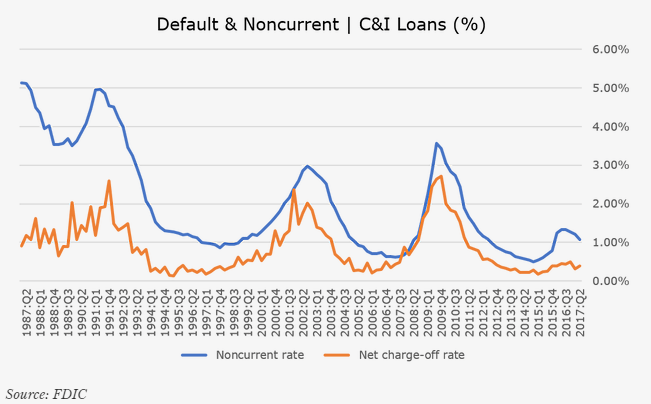
Finally, let’s take a look at the $1.9 trillion portfolio of commercial and industrial (C&I) loans, traditionally one of the most important indicators of future US economic growth. Defaults and non-current rates are both below the averages going back to the 1980s, while credit spreads are as compressed as ever over that same time period. The chart below shows net defaults and non-current rates for all bank-owned C&I loans. Notice that net charge-offs are below non-current loans, which may end up being worked out or restructured short of a formal default.
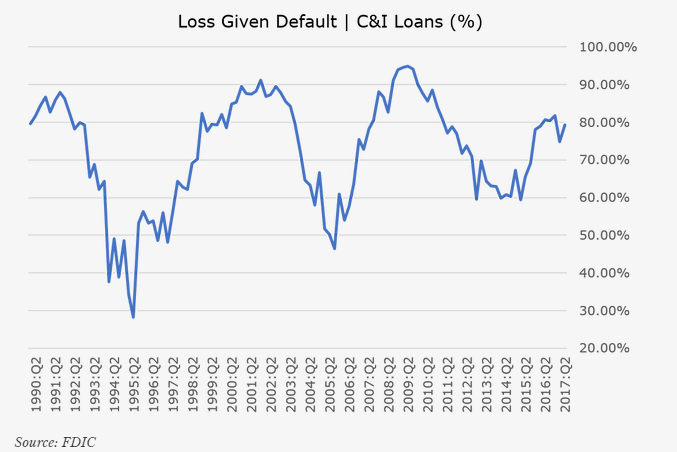
While the chart for net-charge offs for C&I loans looks relatively normal compared to the real estate related asset types, loss rates measured by LGD have been climbing since 2015. More important, new loan production rates (as well as sales) are falling so that the portfolio of bank owned C&I loans is no longer growing very much. This suggests that the US economy is slowing and demand for credit is therefore on the wane. The chart below shows LGD for all C&1 loans.
It’s important to note that the charge-offs and recoveries reported in each period by FDIC insured banks are disparate events. A recovery reported today might be related to a loan charged off three years ago. But the key element of price is reflected in the aggregate data reported by each bank, so that a rising recovery rate/falling LGD strongly suggests that prices in the underlying market are quite frothy. Just as in the 2000s and the 1990s, the Fed again has stoked an asset price bubble in real estate that may lead to significant losses for banks and bond investors should prices correct.
Whoever gets the top job at the Fed, the FOMC must live with the balance sheet and market conditions served up by Chair Yellen and her predecessor, Ben Bernanke. While the Fed’s initial focus on narrowing credit spreads was correct, the FOMC should have stopped after QE1 ended in 2010. Instead, concerned that banks were not lending, the Fed continued to buy securities.
The Fed has kept the pedal to the metal, repeating the errors of the 2000s by fueling a credit driven bubble in residential real estate. This time around, the bubble is more focused on affluent areas of the country, but the result is likely to be more tears.
BTW, we’re rooting for Kevin Warsh as the dark horse candidate for the Fed job in the event that White House chief of staff Gary Cohn decides to stay put. But the biggest challenge facing Yellen's successor as Fed Chair is having the courage to admit that inflating asset bubbles does not create jobs or prosperity, just future financial crises.
EDITOR'S NOTE
This Hedgeye Guest Contributor piece was written by Christopher Whalen, author of the new book Ford Men and chairman of Whalen Global Advisors. Over the past three decades, he has worked for financial firms including Bear, Stearns & Co., Prudential Securities, Tangent Capital Partners and Carrington. This piece does not necessarily reflect the opinion of Hedgeye.
