
Editor's Note: Below is a Hedgeye Guest Contributor research note written by Dr. Daniel Thornton. During his 33-year career at the St. Louis Fed, Thornton served as vice president and economic advisor. He currently runs D.L. Thornton Economics, an economic research consultancy. Please note that guest columns do not necessarily reflect Hedgeye's opinion. In this particular instance, we disagree with a number of Thornton's conclusions. That's what makes a market! Nevertheless, we think it makes sense to consider ideas we don't share. It is a thoughtful piece and a worthwhile read.
Some economists believe that the U.S. is stuck in a period of slow growth. Former Secretary of the Treasury, Larry Summers, calls this secular stagnation, a term coined by Alvin Hansen in the late 1930s to describe what he believed might be the fate of the U.S. economy at that time—a prolonged period of slow growth.
In Summers’ version, the prolonged period of slow growth is a consequence of a lack of aggregate demand due to excessive saving, ("Why Larry Summers Is Wrong About Slow Growth"). Recently, James Bullard, President of the Federal Reserve Bank of St. Louis, has suggested that the economy has shifted into a low growth regime, (Bullard).
Consequently, he now recommends the Federal Open Market Committee (FOMC) keep its target for the federal funds rate no higher than 75 basis points over the next 2.5 years to stimulate growth. This essay shows that the idea that the economy is stuck in a low growth state is misguided. The implication of this analysis is that the FOMC should move quickly to implement the normalization plan that it announced on September 17, 2014.
The view that the economy is stuck in a slow growth period comes in large part from Figure 1, which is commonly presented as evidence of secular stagnation. Figure 1 shows the logarithm of real GDP from 1947Q1 to 2015Q3 along with a trend line that is estimated over the period 1947Q1-2007Q4, i.e., up to the start of the last recession. Real GDP is plotted in logarithms because the slope of a line in logarithms is the growth rate. Figure 1 suggests that real GDP grew at about a constant rate of 3.2% over the 1947-2007 period.
Moreover, the figure suggests that output is not even close to returning to trend. Conclusion: The economy is in a prolonged period of weak growth. Summers calls this secular stagnation; Bullard calls it a regime shift.

But Figure 1 is very deceptive because the growth rate of output has been trending down over the last 70 years. Figure 2 shows a 6-year moving average of the growth rate of real GDP. The figure also shows a trend line estimated using data up to 2007Q4 and extrapolated to 2015Q3. The growth rate of output in the U.S. declined at a fairly steady rate over the period. Trend growth declined from about 4% in the mid-1950s to about 2.75% by 2007.

Consequently, contrary to what Figure 1 suggests, the growth rate of output was not constant over the period from 1947 to 2007. Moreover, the figure shows that if growth stayed on trend, growth over the last six years would be about 2.5%. Growth over the six years ending 2015Q3 is lower, about 2%. But this is not surprising because the 2007-2009 recession was accompanied by an excessive supply of real capital in the forms of residential and commercial real estate.
Hence, there was severe structural unemployment of construction workers, Employment Growth, and slow growth due to the lack of real fixed investment ("Why is Output Growth So Slow?"). The declining trend in output growth over the period is reflected in Figure 1 simply by choosing different ending dates for the trend.
For example, Figure 3 shows two trend lines; one based on data ending in 1970Q4 and the other based on data ending 1994Q4. The former trend line makes it look like the economy has stagnated since the mid-1970s. Summers should have been screaming madly for the last 40+ years; Bullard should have noticed the regime shift much sooner. Things do not look quite as dire if the trend line ending in 1994Q4 is used. But even with this trend line output has been below trend since about 1980.

An alternative way of looking at the data suggests that the economy returned to trend when the recession ended in 2009Q2. Figure 4 shows real GDP over the period 1947Q1-2015Q3 and a quadratic trend line estimated over the period 1947Q1-1994Q4. The figure strongly suggests that output returned to trend when the recession ended in June 2009. Of course, Figure 4 suffers from the same problem as Figure 1; the trend will be markedly different depending on the period used to estimate it.
For example, if the trend had been estimated using data up to 1970Q4, it would be above actual output since the mid-1970s. However, there are good reasons to choose the mid-1990s as the end point for the trend. Specifically, there was a technology boom that began around that time and a subsequent marked increase in construction.

The increase in output beginning in the early 1990s was largely driven by technology and construction. The tech boom was accompanied by a massive rise in the NASDAQ from about 750 in December 1994 to about 4,600 in February 2000—a more than 500% increase in just over 5 years! The equity bubble burst in February 2000 causing the 2001 recession, which was short and mild. The housing boom continued until house prices began falling in late-2006. The result was the 2007-2009 recession, which intensified significantly following Lehman Bros. bankruptcy announcement in mid-September 2008.
This trend line is also supported by the fact that it accurately reflects the recessions and expansions though the 1990-91 recession and expansion. Output is typically below trend during recessions, while output is generally above trend during the subsequent expansions. This is exactly what is expected if the trend line accurately represented the data over the period. Moreover, Figure 4 suggests that the period of anomalous output occurred during the period from the mid-1990s to mid-2007, which is consistent with experience; the economy did very well from the mid-1990s to the beginning of the recession.
Not only does the trend line seem to accurately reflect the trend in real output from 1947 through 1994, it suggests that output returned to trend precisely when the National Bureau of Economic Research (NBER) dated the end of the recession. Consequently, the economy does not need additional stimulus from fiscal policy, as Larry Summers and Alan Blinder ("Does the Economy Need More Spending Now," Thornton 2013) contend. Nor should the FOMC maintain the funds rate low until 2018, as Bullard suggests. Indeed, the figure suggests that the FOMC should have begun the process of normalizing its balance sheet and the funds rate in 2009—early 2010 at the latest.
Indeed, the FOMC should have proceeded as I recommended ("The Federal Reserve’s Response to the Financial Crisis: What It Did and What It Should Have Done"). Specifically, rather than engaging in QE, the FOMC should have allowed the massive loans it made in the wake of Lehman’s announcement to run off. The balance sheet would have returned to normal passively as banks and other financial institutions repaid their loans from the Fed.
The compelling question is not why is economic growth slow now, but rather why has growth trended down over the last 70 years. One answer from economic theory is employment growth has trended down. In the neoclassical growth model, output is determined by labor and capital. The economic fundamentals of the model produce an optimal constant ratio of capital to labor. Consequently, the growth rate of output is solely determined by population growth; in this model everyone works, so population growth and employment growth are the same.
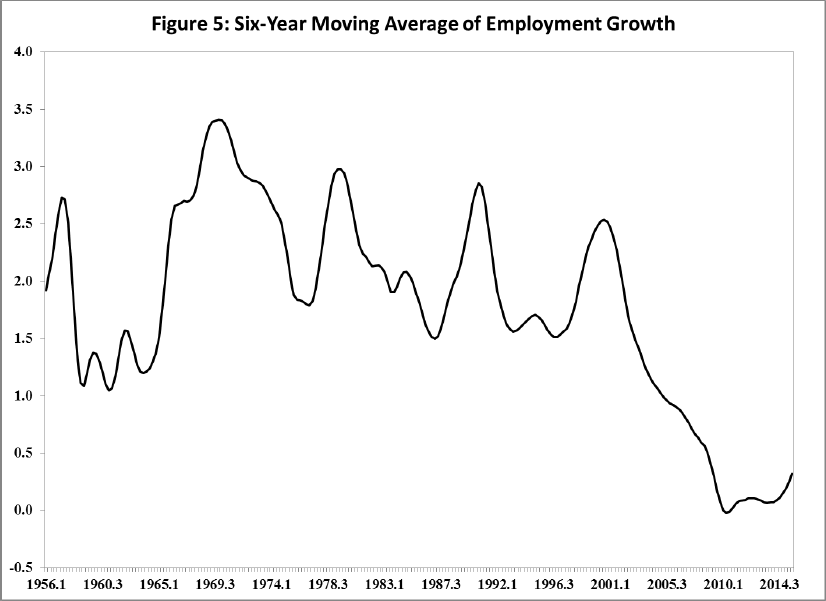
Figure 5 shows the 6-year moving average of the growth rate of total non-farm payroll employment from 1949Q1 to 2015Q3. The growth rate does not trend down over the entire period; however, it has trended down since the mid-1960s. It declined precipitously at the beginning of the 2001 recession. This is largely due to a corresponding decline in the labor force participation rate over the period. But there is no reason to believe that the capital/labor ratio should be constant.
There is some degree of substitutability between capital and labor in virtually every production process. Hence, there should be a negative relationship between the growth rates of labor and the growth of physical capital. Unfortunately, the stock of physical capital is notoriously difficult to measure. However, the secular decline in the growth rate of employment is likely linked to technological innovations that have economized the use of labor.
So what should we conclude from all of this? I believe that there are two important conclusions. First, there is no compelling evidence from the behavior of real GDP of secular stagnation or a regime shift to a low growth state. The current slow growth reflects both this fact and the fact that the last recession was accompanied by a large overhang of physical capital. Combine these facts with:
- A monetary policy that distorted financial markets and the allocation of economic resources over the past 7.5 years ("Monetary Policy Insanity");
- Regulatory overreach, ("Rule of Law in the Regulatory State," Cochrane); and
- Unproductive and distortionary fiscal policy, and you have a perfect explanation for why output growth has been somewhat below its long-run trend;
Furthermore, Figure 4 strongly supports the conclusion that output largely returned to trend when the recession ended in 2009. Figure 2 provides less support for this conclusion, but suggests that the 6-year moving average growth is moving close to trend. These figures, combined with the fact that the recession ended in June 2009, suggest that the FOMC’s monetary policy since 2009 has been misguided. Further monetary policy stimulus is not needed. Indeed, it hasn’t been needed for some time.
Consequently, the FOMC should begin the process of implementing the normalization policy it outlined on September 16, 2014 ("Policy Normalization Principles and Plans," Fed). Specifically, it should begin the process of shrinking its balance sheet back to “normal” and raising the funds rate target to between 3 to 4 percent. The FOMC’s goal should be to achieve these objectives by its June 2017 FOMC meeting.
