“I traded in between classes. I used a lot of pay phones on campus.”
-Ken Griffin
Of the many great interviews Lasse Heje Pedersen did in a must-read book for your investing library, Efficiently Inefficient, the one he did with Citadel’s Founder and CEO, Ken Griffin, ranks amongst the best.
I love learning about successful people in this profession. Getting insight into how they initially thought about building their #process is most interesting to me. Griffin started running money ($265,000) out of his Harvard dorm room in September of 1987.
“I had a satellite dish on top of my dorm room… back then all the decisions were made using paper and pencil and trying to approximate where I thought the bonds should trade based upon cash flow differentials, creditworthiness, and the inherent call protection of the bond… When I was in class, I’d have my HP 12C calculator, a scrap of paper, and think through information in my head and make decisions.” (Efficiently Inefficient, pg 288)
Back to the Global Macro Grind …
Oh boy do I love my HP 12C.
These days, ex a few near the old battle axes who sit with me on the Hedgeye Research Desk (Tom Tobin and Todd Jordan), it’s hard to find the weaponry of these old school calculators. Sometimes the millennials mock that we use them. But we’re cool with that.
If you left me on an island (with no internet connection), here’s what I’d need to make market decisions:
- Notebooks
- Pens (I do not like pencils)
- HP 12C (with supply of batteries)
Oh, and cold beers … and a pay phone (1 call per day at the market close – closing price, volume, and volatility data = #critical).
That way I could build my own time-series by hand and not have to stress myself out, staring at screens all day long, trying to handicap what a bunch of machines are going to do to daily and weekly performance chasers.
Just so you know where my head is at, I’m actually heading out (with all 4 of our kids) on vacation this morning.
When taking “time” away from the screens, the real things that matter to me are my levels on intermediate-to-long-term durations. Within what I call our TRADE/TREND/TAIL model, what I’m talking about are:
- Intermediate-term TRENDS (3 months or more)
- Long-term TAILs (3 years or less)
While meeting with Institutional Investors in Boston for the last two days, I found myself answering the question “where could you be wrong?” using my long-term TAIL risk levels (slide 63 of the Q2 Macro Themes deck):
- US Dollar Index long-term TAIL support = 93.07
- Crude Oil (WTI) long-term TAIL resistance = $45.44
- SP500 long-term TAIL resistance = 2066
- US Equity Volatility long-term TAIL support = 11.71
These “levels” are dynamic (constantly changing as price, volume, and volatility data does), but the general levels on long-term durations don’t change much relative to something like my immediate-term (TRADE) risk range.
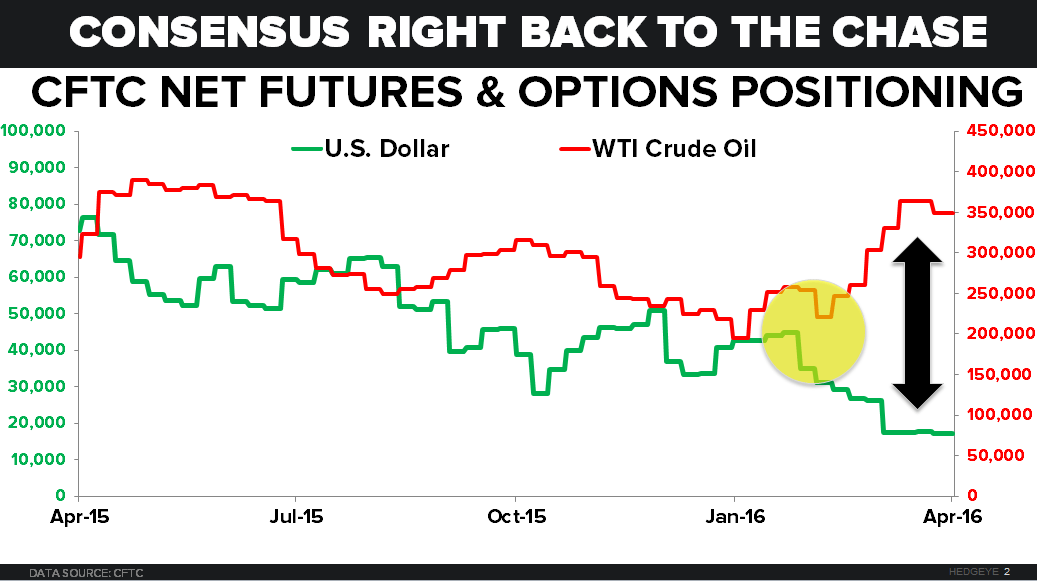
From a longer-term risk management perspective, what’s most interesting to me in macro right now is that:
A) Mostly all of Consensus Macro missed calling the long-term breakout in USD (and commensurate commodity #Deflation)
B) But, on shorter-term durations, consensus is right back in the saddle now, Short USD and Long Oil
C) And this is happening as both the Long-term support for USD is holding inasmuch as long-term resistance for Oil is
So… in addition to keeping shorts on (in Real-Time Alerts) where Earnings Season is our catalyst, maybe what I should do is just buy Dollars, short Oil & Gas Stocks (XOP), turn off my screens for a week…
While that might sound crazy to many who are fighting for their short-term performance lives right now, I think it’s crazier to think all that’s been imploding for the last 2-3 years has “bottomed” because some single-factor simple-moving-average in a chart has.
Crazy is as crazy does, I guess. After all, I’m still the guy using his HP 12C.
Our immediate-term Global Macro Risk Ranges are now (with intermediate-term TREND research views in brackets):
UST 10yr Yield 1.68-1.82% (bearish)
SPX 2030-2077 (bearish)
RUT 1082-1122 (bearish)
NASDAQ 4 (bearish)
Nikkei 152 (bearish)
DAX 9 (bearish)
VIX 13.01-19.03 (bullish)
USD 93.77-95.35 (bullish)
EUR/USD 1.12-1.14 (neutral)
YEN 106.96-111.42 (bullish)
Oil (WTI) 37.09-43.11 (bearish)
Nat Gas 1.91-2.07 (bearish)
Gold 1 (bullish)
Copper 2.05-2.17 (bearish)
Best of luck out there today,
KM
Keith R. McCullough
Chief Executive Officer