

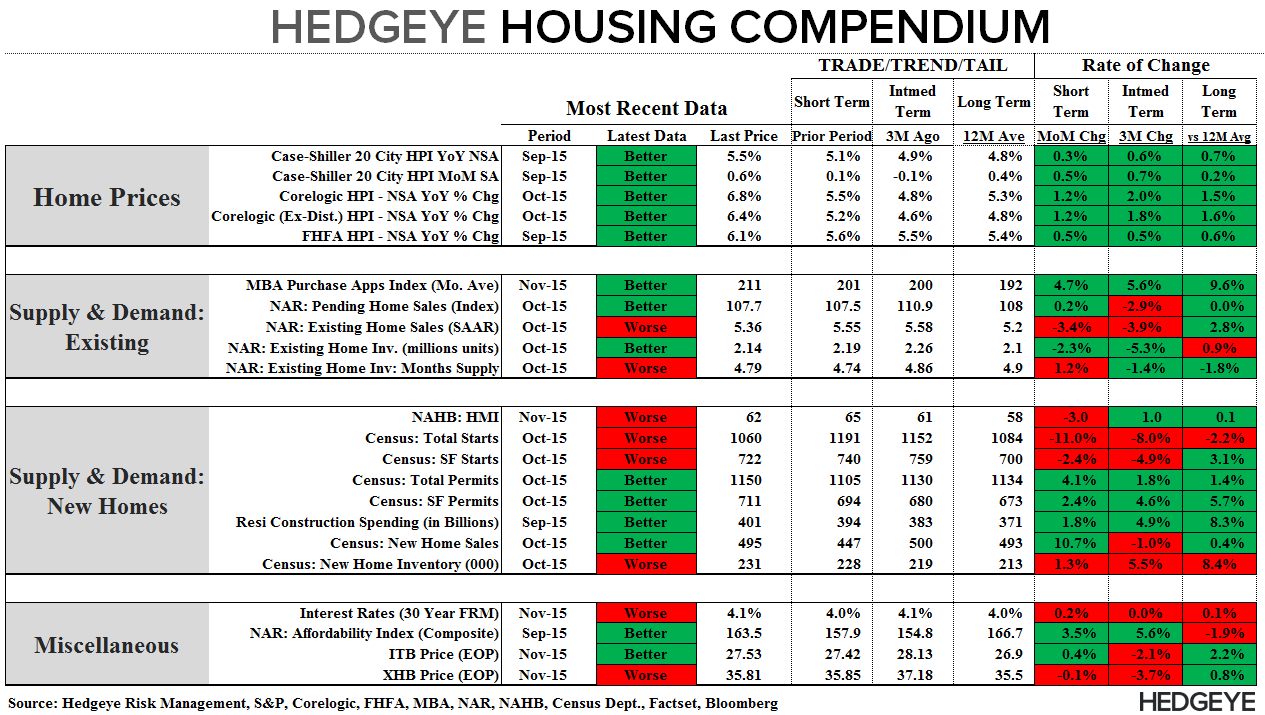
Our Hedgeye Housing Compendium table (below) aspires to present the state of the housing market in a visually-friendly format that takes about 30 seconds to consume.
Today’s Focus: MBA Purchase Applications
Purchase Applications rose +7.7% WoW and accelerated to +30% YoY, taking the demand index up to its strongest level since 2010 at 228.1.
This morning’s data marks a third consecutive week of elevated demand and takes activity in November to the highest monthly average YTD. The strong November also reversed the underwhelming demand trend observed in October, bringing sequential growth in 4Q up to +1.4% QoQ and +22.9% YoY.
The Caveats: Two the last three weeks of data have included holidays (Veteran’s Day, Thanksgiving) and holiday associated statistical adjustments are notoriously imperfect and capable of pushing the data in either direction in any given week.
However, the non-holiday week was also strong and the seasonal factor applied to both of the holiday weeks was not out of line with recent year adjustments – in fact, the adjustment factor applied in 2015 was marginally less supportive of the seasonally-adjusted headline number than what we’ve seen the last couple years.
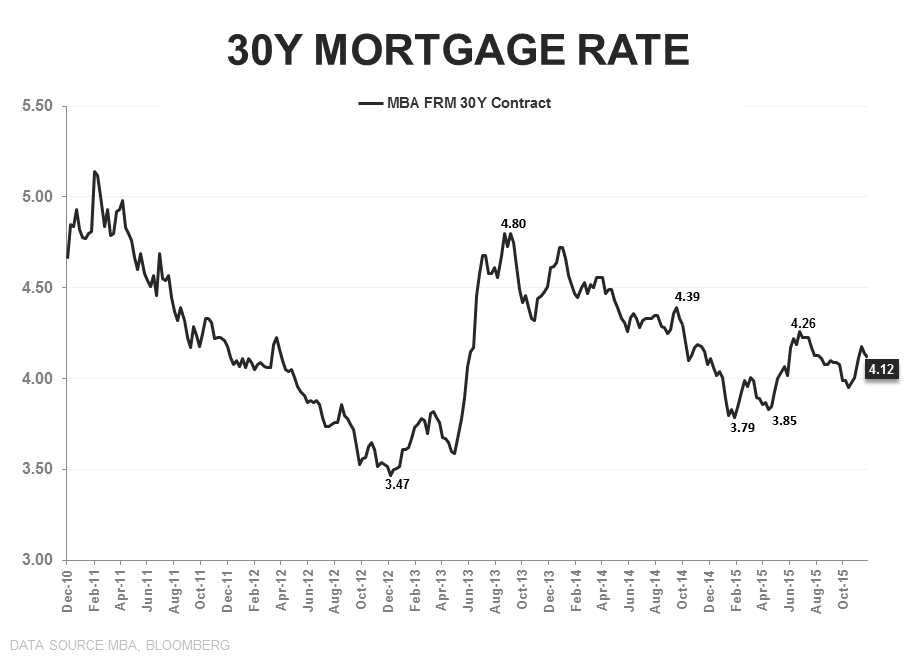
Also, as we’ve highlighted in recent weeks, its more probable than not that we’re seeing some measure of demand pull-forward with prospective buyers pulling the purchase trigger in fear of further financing based affordability declines.
The Conclusion: The new November highs are noisy and perhaps overstate the underlying demand trend but, on balance, the data suggests some measure of uptick in purchase activity in recent weeks aptly characterizes the underlying reality. Seasonal noise will remain a factor for most of the next 6-weeks - ready your grains of salt.


About MBA Mortgage Applications:
The Mortgage Bankers’ Association’s mortgage applications index covers more than 75% of mortgage applications originated through retail and consumer direct channels. It does not include loans delivered through wholesale broker and correspondent channels. The MBA mortgage purchase applications index is considered a leading indicator of single-family home sales and construction. Moreover, it is the only housing index that is released on a weekly basis.
Frequency:
The MBA Purchase Apps index is released every Wednesday morning at 7 am EST.
Joshua Steiner, CFA
Christian B. Drake
