

Investment Company Institute Mutual Fund Data and ETF Money Flow:
Investors continued to play defense in the 5-day period ending October 14th. Money funds gained another +$10 billion, bringing the 4Q15TD total inflow to +$29 billion following the +$54 billion build in money funds in 3Q15. We are entering the seasonally strongest period for money fund growth with a +3.7% average balance build at industry leader Federated Investors since 2007. Long term, active products were bifurcated last week with active equity funds seeing redemptions of -$1.4 billion versus passive stock ETFs which won +$4.4 billion in new business. Both sides of the bond aisle won new business with +$2.4 billion in active bond funds with passive fixed income ETFs winning +$2.0 billion.
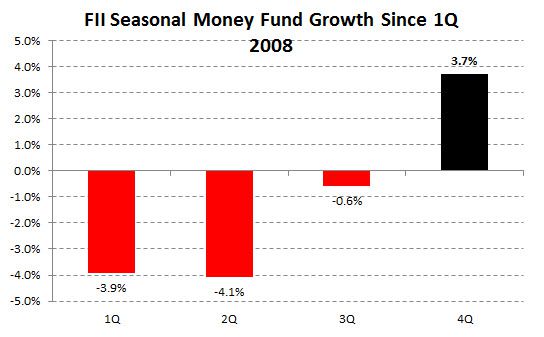
With investors continuing to seek safety, the current market environment supports our Long recommendation on money fund manager Federated Investors (see FII report) and our Short recommendations on active equity managers Janus Capital and T. Rowe Price (See JNS and TROW reports).

In the most recent 5-day period ending October 14th, total equity mutual funds put up net outflows of -$1.5 billion, trailing the year-to-date weekly average outflow of -$404 million and the 2014 average inflow of +$620 million. The outflow was composed of international stock fund withdrawals of -$28 million and domestic stock fund withdrawals of -$1.4 billion. International equity funds have had positive flows in 46 of the last 52 weeks while domestic equity funds have had only 11 weeks of positive flows over the same time period.
Fixed income mutual funds put up net inflows of +$2.4 billion, outpacing the year-to-date weekly average inflow of +$40 million and the 2014 average inflow of +$926 million. The inflow was composed of tax-free or municipal bond funds contributions of +$617 million and taxable bond funds contributions of +$1.8 billion.
Equity ETFs had net subscriptions of +$4.4 billion, outpacing the year-to-date weekly average inflow of +$1.8 billion and the 2014 average inflow of +$3.2 billion. Fixed income ETFs had net inflows of +$2.0 billion, outpacing the year-to-date weekly average inflow of +$1.2 billion and the 2014 average inflow of +$1.0 billion.
Mutual fund flow data is collected weekly from the Investment Company Institute (ICI) and represents a survey of 95% of the investment management industry's mutual fund assets. Mutual fund data largely reflects the actions of retail investors. Exchange traded fund (ETF) information is extracted from Bloomberg and is matched to the same weekly reporting schedule as the ICI mutual fund data. According to industry leader Blackrock (BLK), U.S. ETF participation is 60% institutional investors and 40% retail investors.
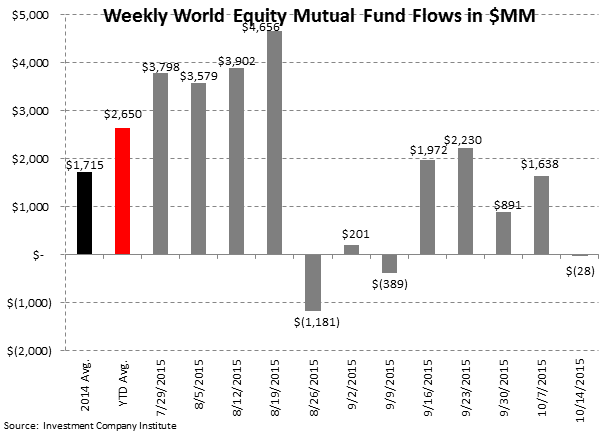
Most Recent 12 Week Flow in Millions by Mutual Fund Product: Chart data is the most recent 12 weeks from the ICI mutual fund survey and includes the weekly average for 2014 and the weekly year-to-date average for 2015:


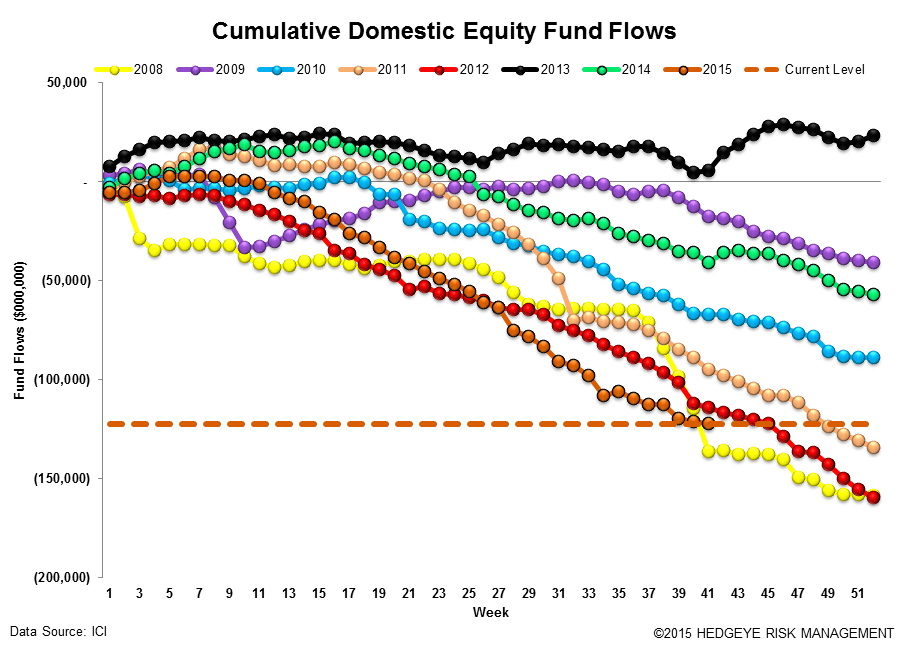
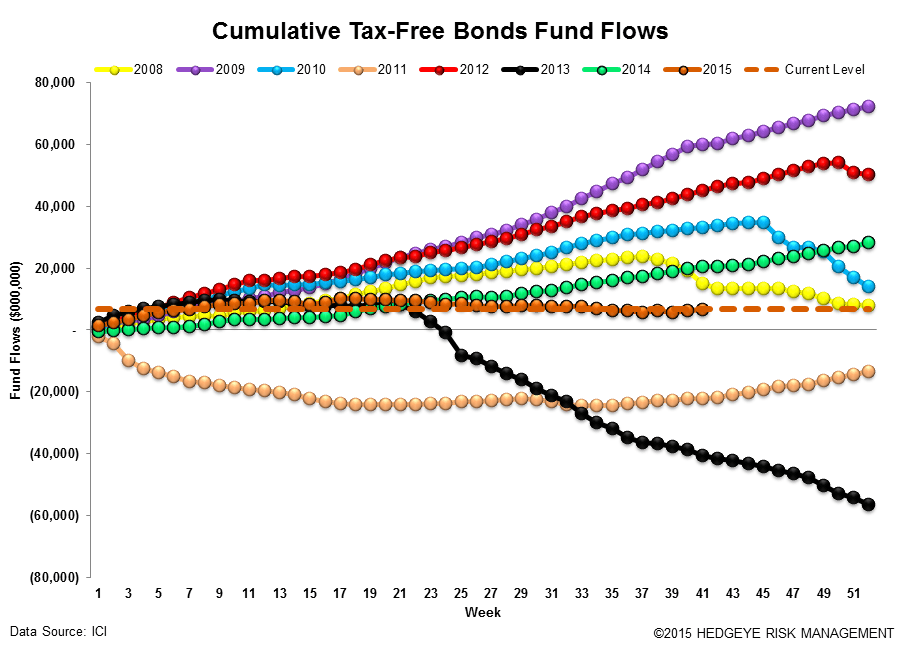
Cumulative Annual Flow in Millions by Mutual Fund Product: Chart data is the cumulative fund flow from the ICI mutual fund survey for each year starting with 2008.


Most Recent 12 Week Flow within Equity and Fixed Income Exchange Traded Funds: Chart data is the most recent 12 weeks from Bloomberg's ETF database (matched to the Wednesday to Wednesday reporting format of the ICI), the weekly average for 2014, and the weekly year-to-date average for 2015. In the third table are the results of the weekly flows into and out of the major market and sector SPDRs:


Sector and Asset Class Weekly ETF and Year-to-Date Results: In sector SPDR callouts, investors poured +$688 million or +11% into the industrials XLI ETF while drawing -$101 million or -5% from the materials XLB.

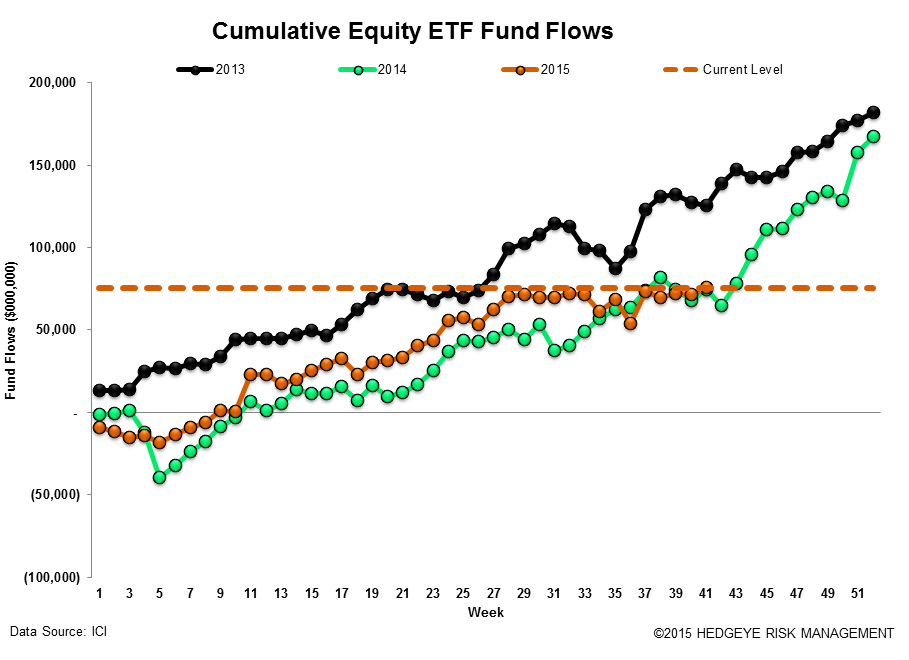
Cumulative Annual Flow in Millions within Equity and Fixed Income Exchange Traded Funds: Chart data is the cumulative fund flow from Bloomberg's ETF database for each year starting with 2013.

Net Results:
The net of total equity mutual fund and ETF flows against total bond mutual fund and ETF flows totaled a negative -$1.5 billion spread for the week (+$3.0 billion of total equity inflow net of the +$4.5 billion inflow to fixed income; positive numbers imply greater money flow to stocks; negative numbers imply greater money flow to bonds). The 52-week moving average is +$1.5 billion (more positive money flow to equities) with a 52-week high of +$27.9 billion (more positive money flow to equities) and a 52-week low of -$19.0 billion (negative numbers imply more positive money flow to bonds for the week.)

Exposures: The weekly data herein is important for the public asset managers with trends in mutual funds and ETFs impacting the companies with the following estimated revenue impact:

Jonathan Casteleyn, CFA, CMT
Joshua Steiner, CFA
