Editor's Note: Below is a chart and brief excerpt from this morning's Early Look written by Hedgeye CEO Keith McCullough. Click here for more information about how you can subscribe.
What did “stocks” do?
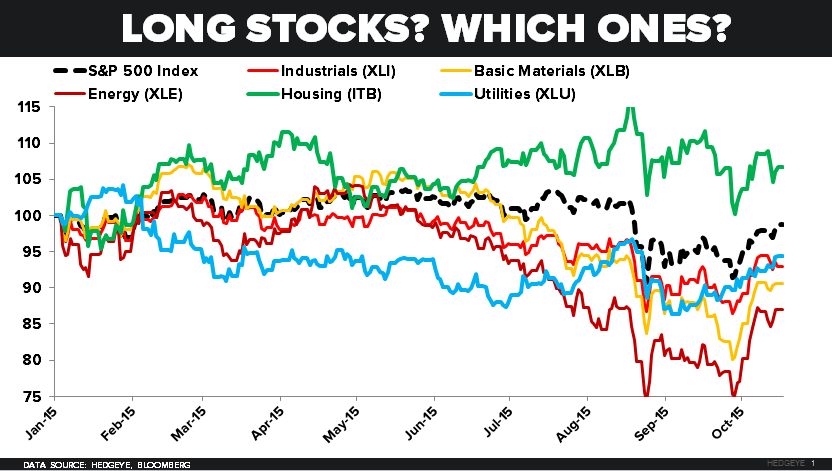
- Utilities (XLU) +2.3% week-over-week were the BEST sub-sector exposure to be long (+2.3% in the last 3 months)
- REITS (MSCI Index) +1.2% week-over-week and +1.4% in the last 3 months (vs. SP500 down -4.3% in the last 3 months)
- Industrials (XLI) deflated another -1.6% last week and have lost -4.4% in the last 3 months
