


This morning, I'd like you to focus on the chart below - context is critical.
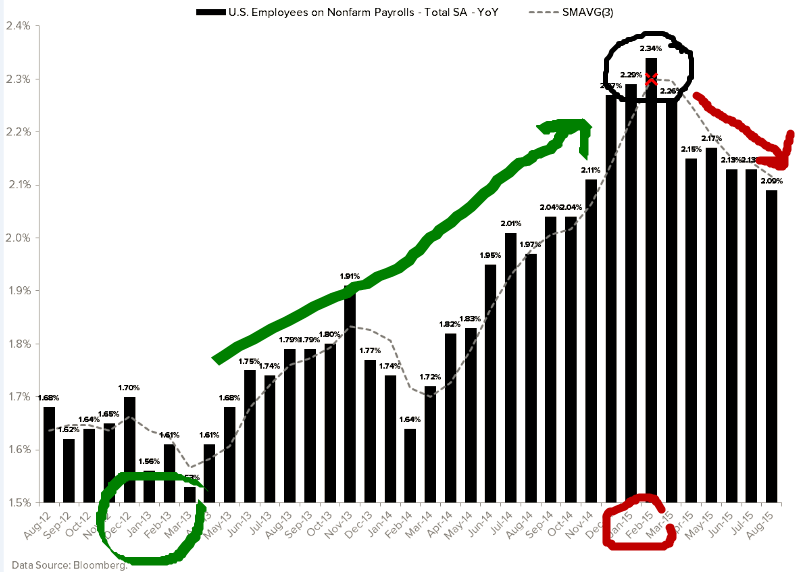
As many of you already know, my team and I here at Hedgeye got bullish on employment growth (and US growth) when this chart bottomed in 2012 - it's bearish now.
On a related note, please bear in mind that our firm's call (for 20 months) has been that the biggest risk to the market is the Fed's forecasts. Their forecasts (on both growth and inflation) in 2015 have been flat out wrong.
The data is slowing. Period.
Now, back to your centrally-planned morning.
