

Our Hedgeye Housing Compendium table (below) aspires to present the state of the housing market in a visually-friendly format that takes about 30 seconds to consume.

Today's Focus: November NAHB HMI (Builder Confidence Survey)
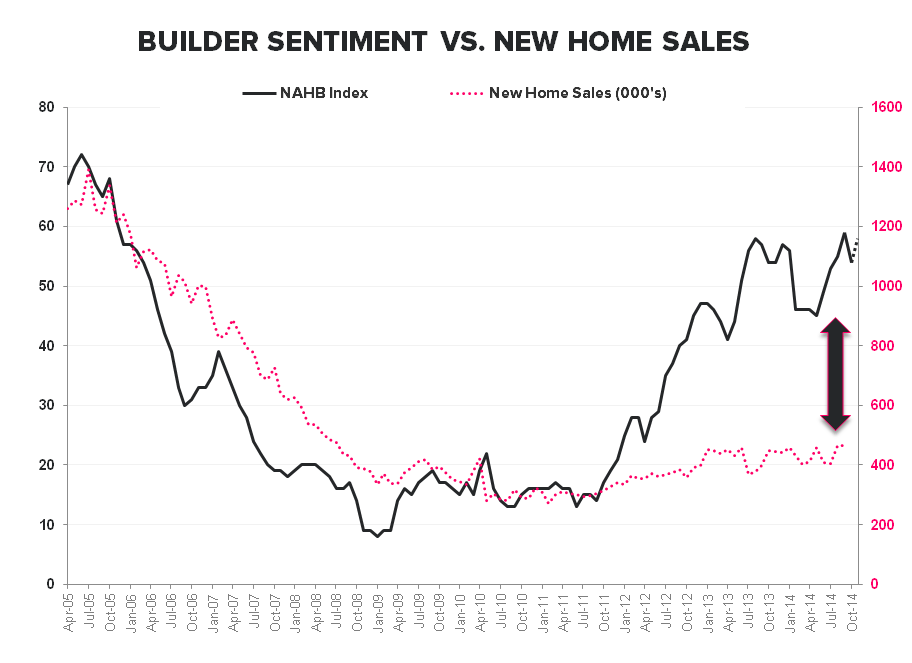
Home builder confidence rose to 58 on the NAHB HMI Index in November, a +4pt increase vs September and just under the 9-year high reading recorded in September.
It has taken the balance of the year but confidence has retraced back to the pre-polar vortex levels observed in the July to December period of 2013. What hasn’t rebounded - despite some intermittently solid reports out of a selection of the publicly traded homebuilders - is actual, aggregate new home sales which have done virtually nothing over the TTM.
Perhaps builder’s are co-opting our top down view and considering the implications of a 2nd derivative stabilization in HPI in conjunction with progressively easier volume comps and looser regulation but, given the ongoing divergence between confidence and construction YTD, we’re more inclined to view the November advance in sentiment as a simple continuation of trend.
- Sub-Indices: After declining in October, all 3 sub-indices rose MoM with the magnitude of increase in Current Sales (+5pts) outpacing more modest increases in Current Traffic (+4pts) and 6M Expectations (+2pts) and driving a moderate sequential compression in the “optimism spread”.
- Regional: Builder Confidence gained across all regions with the 12 point gain in the Northeast – the largest sequential change in a year and the 2nd largest since 2010 - being the most notable.
We’ll get the housing starts/permits data for October tomorrow, but with SF starts up just 2.8% YoY on ave YTD and permits middling, we don't see much upside for single family construction to close out the year.
NAHB COMMENTARY:
“Growing confidence among consumers is what’s fueling this optimism among builders,” said NAHB Chairman Kevin Kelly. “Members in many areas of the country continue to see increasing buyer traffic and signed contracts.”
“Low interest rates, affordable home prices and solid job creation are contributing to a steady housing recovery,” said NAHB Chief Economist David Crowe. “After a slow start to the year, the HMI has remained above the 50-point benchmark for five consecutive months, and we expect the momentum to continue into 2015.”
BOTTOM LINE - THE CALL HAS BEEN WORKING BUT THE DATA'S TURNING
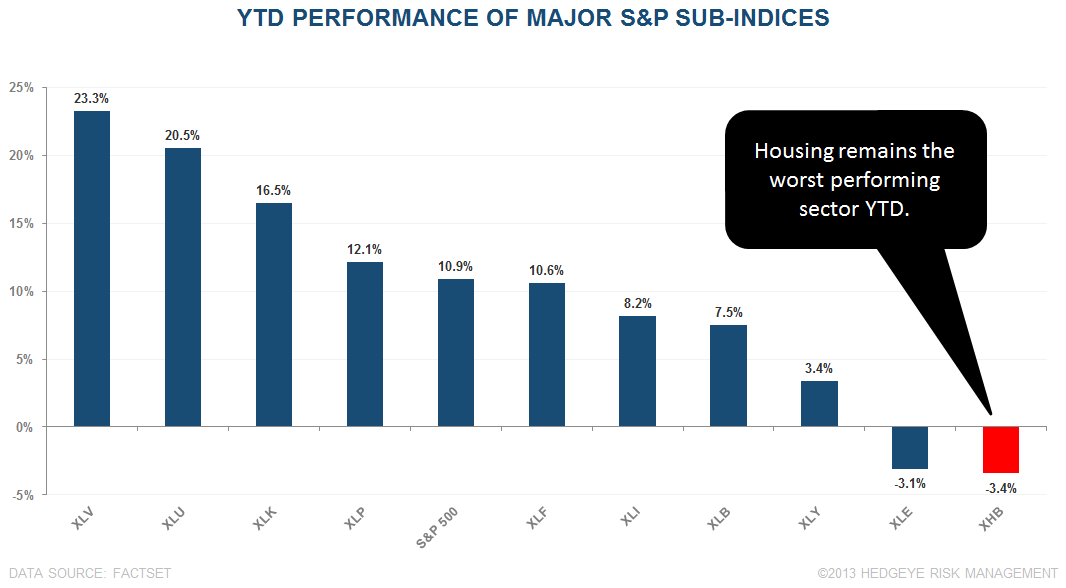
Our bearish call on housing thus far in 2014 has been playing out as the XHB remains the worst performing sector YTD. That said, many of the negative dynamics that we flagged earlier this year have largely or completely played out and we're now seeing some signs of light at the end of the tunnel (see the volume of "green" in the compendium at the top of this note). We'll be hosting a call in early December to update our views on housing heading into 2015.


About the NAHB HMI:
The Housing Market Index (HMI) is based on a monthly survey of NAHB members designed to take the pulse of the single-family housing market. The monthly survey has been conducted for 30 years. The survey asks respondents to rate market conditions for the sale of new homes at the present time and in the next 6 months as well as the traffic of prospective buyers of new homes. The HMI is a weighted average of separate diffusion indices for these three key single-family series. The HMI can range from 0 to 100, where a value over 50 implies conditions are, on average, improving, a value below 50 implies conditions are worsening, and an index value of 50 indicates that the housing market is neither improving nor worsening.
Joshua Steiner, CFA
Christian B. Drake
