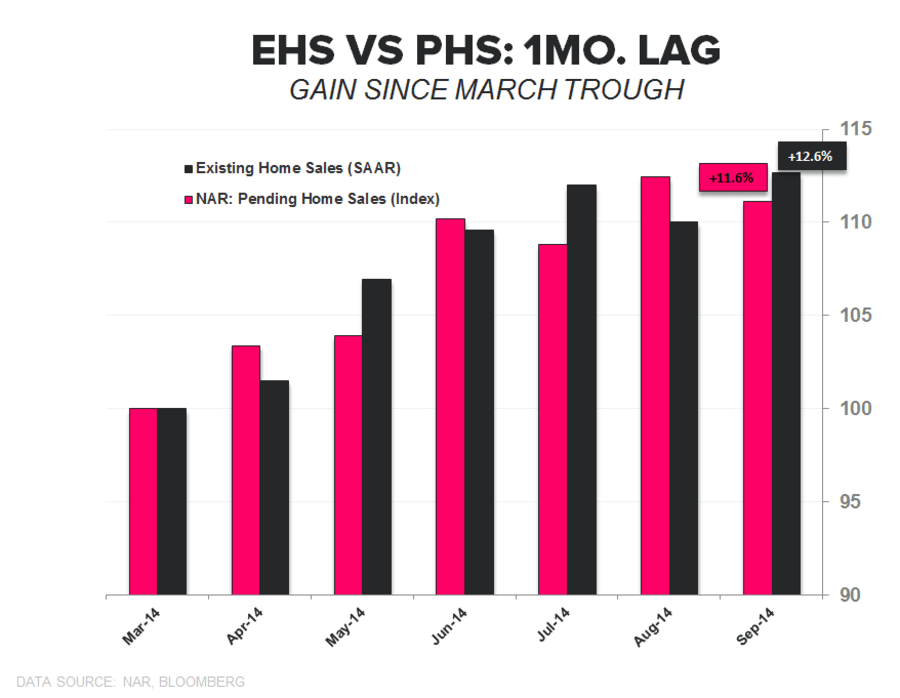
As we've highlighted, there's limited usefulness in the Existing Home Sales (EHS) report on the sales side since the data is well-telegraphed by the Pending Home Sales report a month earlier. We show this in the 1st chart below, where we've offset the EHS data by one month to show its correlation to PHS on a 1-month lag.
Despite the limited real-time utility in terms of demand trends, there is value in the data on inventory and the composition of sales (first-time buyers, cash buyers, investor share). This month we flag the still-anemic level of first time homebuyers (29% vs 2001-2008 average of ~40%).

TOTAL EXISTING HOME SALES: Total EHS resumed its uptrend in September after stumbling in August. Sales rose 2.4% MoM to 5.17mn SAAR. Meanwhile, the year-over-year rate of change slowed to a decline of 1.7%, an improvement vs the 5.3% decline in August. From a growth perspective, the YoY comps get progressively easier through the balance of the year as we lap the rising rate environment of 2H13.
For comparison, pending home sales have advanced +11.6% since the trough in March vs +12.6% for EHS and, given the recent pattern highlighted above, it’s likely we see a modestly worse sequential EHS print in October.
